Back to article: Dynamics of cell membrane lesions and adaptive conductance under the electrical stress
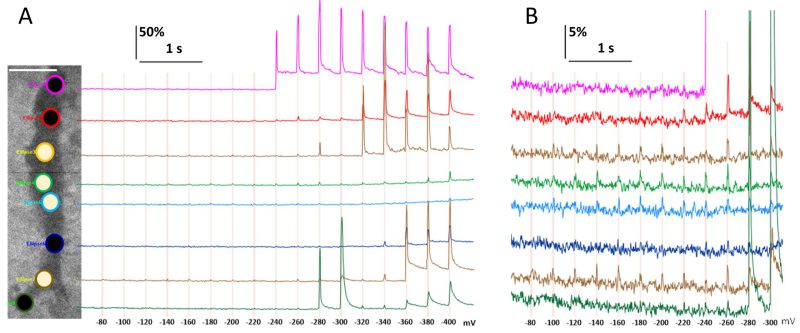
FIGURE 7: Low-threshold zonal electropermeabilization (ZEP) revealed by fluorescence scintillae coincident with voltage steps. (A) A sample cell subjected to sequential voltage steps from -80 to -400 mV (see Fig. 2A and Methods for details). The image shows the cell’s footprint (darker area) with selected regions of interest (ROIs). Bar: 10 µm. Pixel intensity was averaged across each ROI, normalized to its mean value prior to the first voltage step (F/F0 x 100%), and plotted over time. The color of each fluorescence trace matches the outline of the respective ROI. The voltage steps are marked by vertical grid lines with legends underneath, mV. The white- and black-filled ROIs are those where ZEP was and was not observed, respectively. (B) Same data presented on a 10× expanded vertical scale to emphasize ZEP occurrences.