Back to article: Dynamics of cell membrane lesions and adaptive conductance under the electrical stress
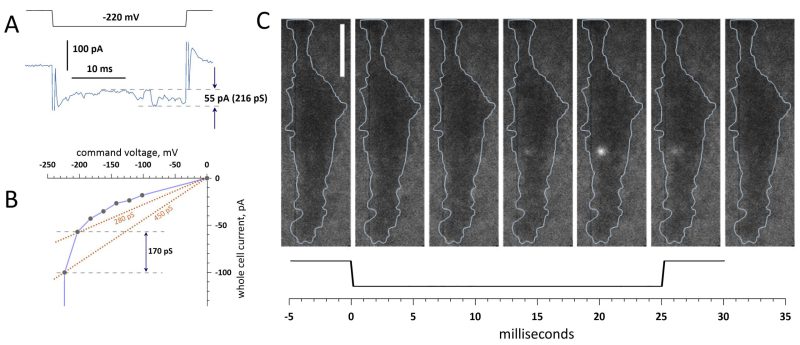
FIGURE 6: Changes in the whole-cell current and conductance measurements of a short-lived electropore. (A) Current recorded during a -220 mV voltage step in a representative cell. Fluctuations marked by dashed lines coincide with the appearance of a single fluorescence transient and correspond to a 216-pS conductance change. (B) Estimation of the same pore conductance using a whole-cell current−voltage curve. The chord conductance at -200 mV (no fluorescence response) was 280 pS. At -220 mV it became 450 pS and a single fluorescence spot formed. The difference of 170 pS is assumed to result from the pore formation. Currents were measured at 20 ms into the voltage step. (C) Consecutive TIRF images (left to right, 5.65 ms/frame) taken before, during and after the step to -220 mV shown underneath. The blue contours emphasize the cell boundary. Bar: 10 µm. See text and Fig. 5 for more details.