Back to article: Dynamics of cell membrane lesions and adaptive conductance under the electrical stress
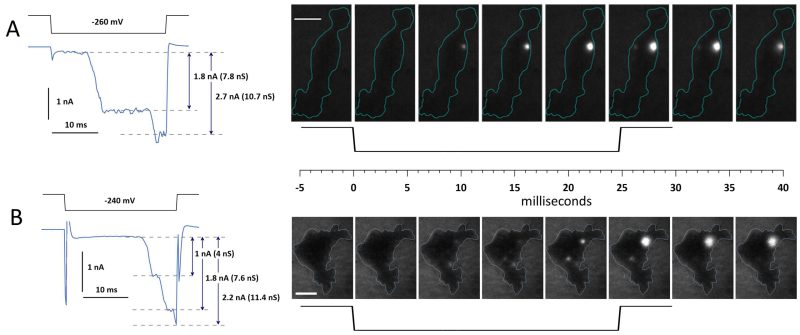
FIGURE 5: Changes in the whole-cell current and Ca2+ transients during the formation of a persistent electropore. (A and B), two representative cells responding to a 25-ms hyperpolarization from 0 to -260 mV (A) and to -240 mV (B; black traces). Stepwise increments of the whole-cell current (blue traces underneath) parallel the formation of bright spots of Ca2+ fluorescence in TIRF images. Legends in the graphs show the amplitude of the current increments between the dashed lines (nA) and the respective whole-cell conductance increments (nS). The images were taken every 5.65 ms before, during, and after the voltage step shown underneath. Blue contours emphasize the cell boundary. Bar: 10 µm. See text for more details.