Back to article: Dynamics of cell membrane lesions and adaptive conductance under the electrical stress
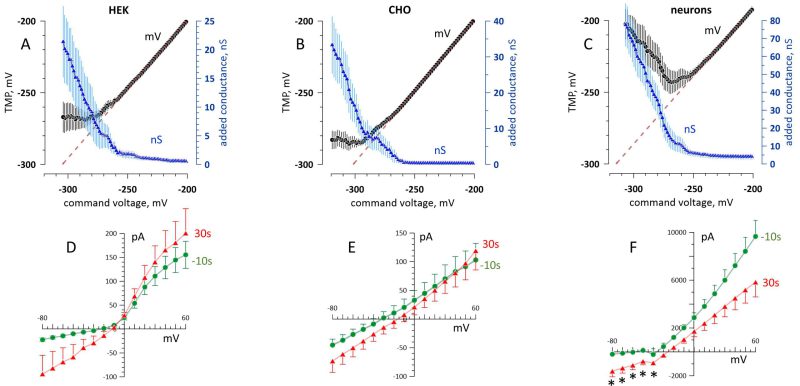
FIGURE 4: The adaptive conductance increase (A-C) and post-electroporation recovery (D-F) in three cell types. Cells of different origins (labeled above the graphs) were hyperpolarized beyond the electroporation threshold by 200-ms voltage ramps. (A-C) Effect of the command voltage on the induced TMP, mV (left scale, black symbols) and on the added membrane conductance, nS (right scale, blue symbols). The initial portion of the ramps (above -200 mV) is just linear and is not shown. The dashed lines are the linear fits through the TMP range before electroporation. (D-F) Current-voltage data recorded in the same cells 10 s prior to the electroporation and 30 s after it. Shown are mean values ± s.e. for n = 9 (HEK and CHO cells) and n = 6 (neurons). * p<0.02 (two-sided t test) between pre- and post-electroporation measurements; for all datapoints without labels, p>0.05. See Fig. 3 and text for more detail.