Back to article: Cold exposure reinstates NAD+ levels and attenuates hepatocellular carcinoma
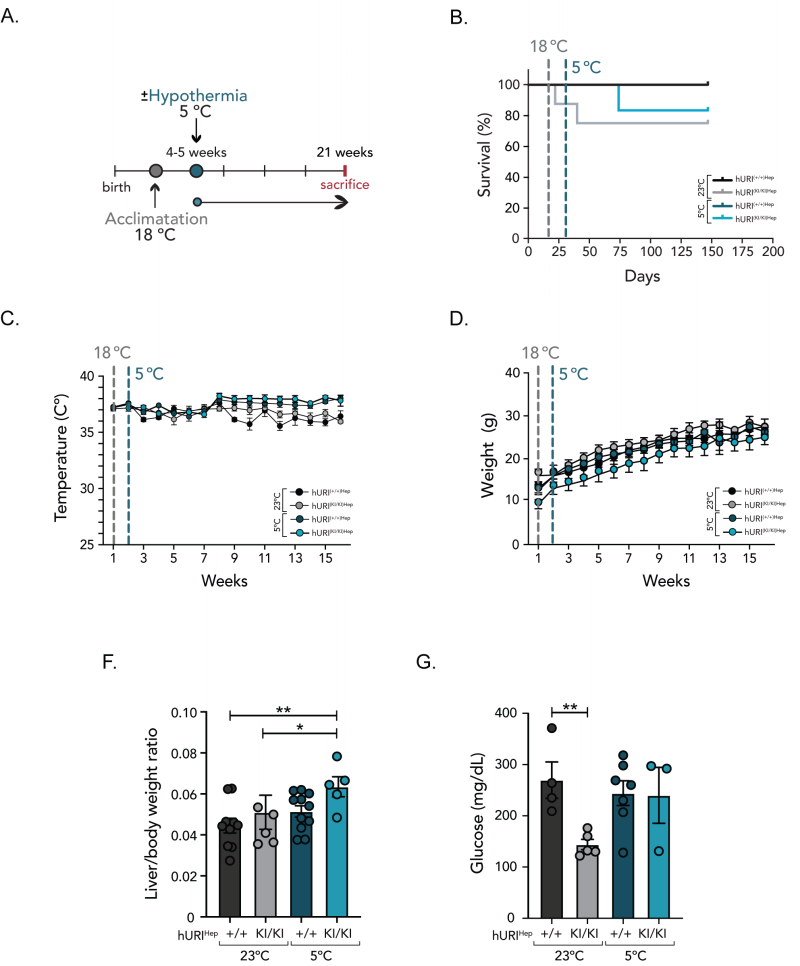
FIGURE 2: Lifespan-enhancing properties of cold in hURI overexpressing mice. (A) Scheme of hURIHep mice exposed to CT. Mice were exposed to an acclimatization period (one week at 18◦C after weaning) followed by CT (18 weeks at 5±1◦C). Control hURIHep mice were exposed to RT (23±1◦C). hURIHep mice were sacrificed at 21 weeks of age. (B) Survival curve of hURI(+/+)Hep [n=11], hURI(KI/KI)Hep [n=8] mice exposed to normal RT conditions, and hURI(+/+)Hep [n=11] and hURI(KI/KI)Hep [n=6] mice exposed to CT. (C) Core body temperature record of hURI(+/+)Hep [n=11], hURI(KI/KI)Hep [n=8] mice exposed to normal RT conditions, and hURI(+/+)Hep [n=11] and hURI(KI/KI)Hep [n=6] mice exposed to CT. (D) Weekly measurements of hURI(+/+)Hep [n=11], hURI(KI/KI)Hep [n=8] mice exposed to normal RT conditions and hURI(+/+)Hep [n=11] and hURI(KI/KI)Hep [n=6] mice exposed to CT. (E) Liver to body weight ratio of hURI(+/+)Hep [n=10], hURI(KI/KI)Hep [n=6] mice exposed to normal RT conditions, and hURI(+/+)Hep [n=11] and hURI(KI/KI)Hep [n=5] mice exposed to CT. (F) Glucose in blood of hURI(+/+)Hep [n=4], hURI(KI/KI)Hep [n=5] mice exposed to normal RT conditions, and hURI(+/+)Hep [n=7] and hURI(KI/KI)Hep [n=3] mice exposed to CT. Statistical analyses were performed using Kaplan-Meier curve (B) or multiple comparison ANOVA test (E-F). Unless otherwise indicated, data are represented as mean ± s.e.m from n independent experiments; *P ≤ 0.05, **P ≤ 0.01.

