Research Articles:
Cell Stress, Vol. 8, No. 1, pp. 69 - 82; doi: 10.15698/cst2024.08.298
Dynamics of cell membrane lesions and adaptive conductance under the electrical stress

Frank Reidy Research Center for Bioelectrics, Old Dominion University, VA, Norfolk, USA.
Keywords: electroporation, electropermeabilization, membrane lesions, membrane repair, TIRF.
Abbreviations:
ITO - indium tin oxide,
ROI - region of interest,
TIRF - total internal reflection fluorescence,
TMP - transmembrane potential,
ZEP - zonal electropermeabilization.
Received originally: 08/05/2024 Received in revised form: 24/07/2024
Accepted: 06/08/2024
Published: 09/08/2024
Correspondence:
Andrei G. Pakhomov, Frank Reidy Research Center for Bioelectrics, Old Dominion University, 4211 Monarch Way, Suite 300, Norfolk, VA 23508; (210) 204-9012, (757) 683-8003; Fax: (757) 451-1010; 2andrei@pakhomov.net; apakhomo@odu.edu
Conflict of interest statement: The authors declare no competing interests.
Please cite this article as: : Mantas Silkunas, Olga N Pakhomova, Giedre Silkuniene, Andrei G. Pakhomov (2024). Dynamics of cell membrane lesions and adaptive conductance under the electrical stress. Cell Stress 8: 69-82. doi: 10.15698/cst2024.08.298
Abstract
Exceeding physiological limits of the cell membrane potential compromises structural integrity, enabling the passage of normally impermeant solutes and disrupting cell function. Electropermeabilization has been studied extensively at the cellular scale, but not at the individual membrane lesion level. We employed fast total internal reflection fluorescence (TIRF) imaging of Ca2+ entry transients to discern individual lesions in a hyperpolarized cell membrane and characterize their focality, thresholds, electrical conductance, and the lifecycle. A diffuse and momentary membrane permeabilization without a distinct pore formation was observed already at a -100 mV threshold. Polarizing down to -200 mV created focal pores with a low 50- to 300-pS conductance, which disappeared instantly once the hyperpolarization was removed. Charging to – 240 mV created high-conductance (> 1 nS) pores which persisted for seconds even at zero membrane potential. With incremental hyperpolarization steps, persistent pores often emerged at locations different from those where the short-lived, low-conductance pores or diffuse permeabilization were previously observed. Attempts to polarize membrane beyond the threshold for the formation of persistent pores increased their conductance adaptively, preventing further potential build-up and ”clamping” it at a certain limit (-270 ± 6 mV in HEK cells, -284 ± 5 mV in CHO cells, and -243 ± 9 mV in neurons). The data suggest a previously unknown role of electroporative lesions as a protective mechanism against a potentially fatal membrane overcharging and cell disintegration.
INTRODUCTION
Pulsed electric fields are widely used in medical applications ranging from neuromodulation and neuromuscular stimulation to tissue and cancer ablation. Charging of the cell membrane plays a crucial role in determining the outcome of such treatments. Whenever cells are exposed to an external electric field, e.g., to induce action potentials by depolarizing the cathode-facing cell side, the anode-facing side becomes hyperpolarized. Hyperpolarization beyond physiological limits may disrupt membrane barrier function in a process known as electroporation or electropermeabilization 1, 2, rendering the membrane leaky to ions and small polar solutes and impacting cell function and survival. Electroporation-induced Ca2+ entry triggers membrane repair 3, 4, 5 as well as phosphoinositol- and Ca2+-induced Ca2+-release-mediated signaling 6, 7, with downstream effects ranging from muscle contraction 8, 9 and neurotransmitter release 10, 11 to mitochondrial damage 12 and apoptotic or necrotic cell death 5, 13, 14, 15. Early responses to electroporation include depolarization of the resting membrane potential 16, 17, K+ and ATP depletion 15, 18, cell blebbing and swelling 19, 20.
Electroporation can take place during a routine therapeutic electrostimulation, due to the electric field non-uniformity and reaching the excessively high field strength near electrodes 21, 22. Electroporation is a significant pathogenic factor in defibrillation 23, 24 and in electrical injury 25. Conversely, controlled electropermeabilization is essential for achieving therapeutic goals in gene electrotransfer, pulsed field ablation for atrial fibrillation, cancer ablation, and electrochemotherapy 26, 27, 28, 29, 30, 31. Both the adverse and beneficial effects of electroporation hinge on the longevity of the permeabilized state that may last minutes or even hours. However, the nature of this lasting state remains elusive. Limited understanding of electrical stress response mechanisms impedes effective mitigation of its adverse effects as well as the advancement of electroporation-based therapies.
The standard theory of electroporation explains membrane permeabilization by the formation of aqueous pores in the presence of a high transmembrane potential (TMP) 32. As shown by molecular dynamics simulations 33, 34, pore creation begins with water protrusion into the lipid bilayer, followed by the reorganization and migration of phospholipid head groups that line up forming a hydrophilic pore. Removal of the electric field causes pore degradation and annihilation within just tens of nanoseconds, and this time is independent of the voltage that creates the pore. Instant pore closure, within the measurement accuracy, is also typical for electroporation of planar lipid bilayers 32, 35, 36, 37, with isolated exceptions 38. Pores can be stabilized by applying a sustaining electric field 39, 40 and with current clamp 41, 42. In stark contrast to models, live cells remain leaky for seconds or minutes after an electroporating pulse, even if no electric field is applied 18, 35, 43, 44, 45. It is the long-lasting permeabilization that produces the bioeffects described above and enables various electroporation-based technologies and treatments 35. Neither the standard aqueous pore theory nor other theories (reviewed in 32) explain the persistent membrane leakiness in live cells. The presence of proteins, the complex chemical composition of the cell membrane, and its anchoring to the cytoskeleton have been discussed as possible causes of pore stability 5, 20, 35, 46, 47 but have yet to be validated by experiments. An alternative viewpoint is that lasting permeabilization in cells does not involve pores at all: Although pores may briefly form during an electric pulse, they rapidly close, as molecular simulations predict, whereas the persistent leaky state results from a chemical modification (peroxidation) of bilayer-forming lipids 20, 48. Indeed, molecular models confirm that peroxidation makes the bilayer more permeable, and experiments show that oxidation may take place in the cell membrane subjected to an electric field 5, 49, 50, 51. However, in cell experiments oxidation occurred only in the anode-facing portion of the membrane; it was not observed at the cathode-facing side even at field strengths much higher than those needed for electroporation 50. Applying pulses in a low-conductance medium enhanced permeabilization but reduced oxidation, indicating that oxidation is a side effect rather than the cause of persisting leakiness. More recent molecular simulation studies have shown that although peroxidation increases membrane permeability by several orders of magnitude, this increase does not explain the still larger effect observed in experiments 52, 53. The authors suggested that secondary peroxidation products may organize in patches that form long-lifetime nanometer-size pores 53. The authors also noted that proving this idea with existing instrumentation does not appear possible.
We recently introduced an adaptation of the optical single-channel recording method that enables dynamic observation of discrete electropores in live cells 54. Pores in a cell membrane adjacent to a transparent electrode were identified by discrete Ca2+ transients using total internal reflection fluorescence (TIRF) microscopy. We demonstrated pore persistence for more than a minute after electroporation with no TMP applied and measured single-pore conductance at 30 and 60 s post pulse. The present study aimed to exploit new capabilities of this method to reveal the details of conductance increase and pore formation in a hyperpolarized cell membrane. We have identified and characterized three distinct types of electropermeabilization, with a threshold at only -100 mV. We found that permeabilization may protect against further TMP build-up and membrane disintegration. We demonstrated that the TMP cannot exceed a critical value of approximately -260 mV (-240 to -280 mV in different cell types). Any attempts to hyperpolarize the TMP further dynamically made the pores more conductive, thus “clamping” or even depolarizing the TMP.
RESULTS
Membrane disruption by hyperpolarization and electropore detection
A whole-cell voltage clamp configuration was established in HEK 293 cells placed on glass coverslips with an indium tin oxide (ITO) layer as the electrical ground (Fig. 1A). Hyperpolarizing voltage steps applied between the pipette and the ITO created lesions (electropores) in the membrane adjacent to the ITO. In cells loaded with a Ca2+-sensitive fluorophore, admission of Ca2+ through the pores elicited focal fluorescence transients detectable by TIRF imaging (Fig. 1B and C). At a threshold of approximately -200 mV, we observed one or several bright spots that appeared at random locations within the cell footprint. Larger hyperpolarizing steps increased the brightness, the size, and the number of fluorescence transients, which did not necessarily appear at the same locations as with the smaller steps (arrows in Fig. 1B and C). This pattern indicates that preexisting lesions, by increasing local membrane permeability and reducing charging efficiency, could confer a protective effect and make the membrane locally less vulnerable to larger voltage steps.
–
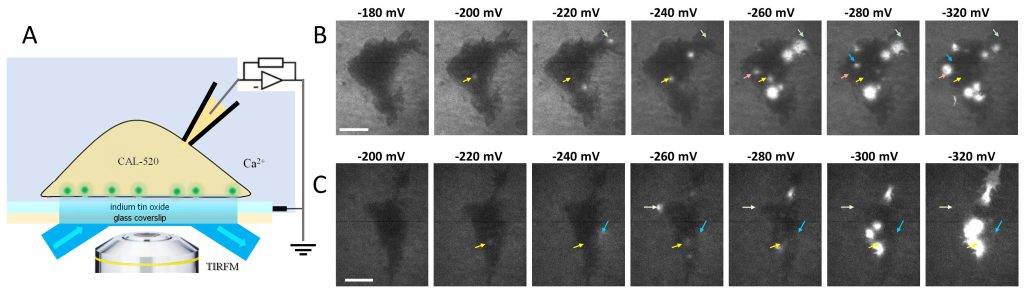 |
FIGURE 1: Electropore detection by imaging Ca2+ transients. (A) A schematic of the setup that enables TIRF imaging of electroporated cell membrane. A cell is placed on a transparent indium tin oxide (ITO) electrode on a glass coverslip and loaded with the Ca2+ fluorophore CAL-520 via a patch clamp pipette. Voltage steps applied between the pipette and the ITO create membrane lesions that admit Ca2+ into the cell producing fluorescence transients (pictured by small green spheres). (B and C) TIRF images of Ca2+ transients in two cells subjected to hyperpolarizing voltage steps. Each step was from zero to the indicated voltage (mV) and lasted 25 ms. The leftmost images show a subthreshold stimulation with no visible fluorescence spots. In the next images, arrows highlight the transients that were not necessarily re-evoked by larger voltage steps. The arrows maintain the same position across all the images. Bar: 10 µm. In panel B, the brightness of the three images on the left was enhanced for visual clarity. |
Fig. 2A illustrates a typical experiment aimed at determining the threshold, time course, and voltage dependence of electroporation. A series of 16 voltage steps, from zero to negative voltages ranging from -80 to -380 mV in 20-mV increments, was applied concurrently with taking cell images at a rate of 5.65 frames/s. With a 25-ms step duration and 350-ms intervals, one experiment took approximately 6 s. Fluorescence transients evoked by voltage steps just above their threshold (-200 and -220 mV steps) were short-lived and disappeared once the voltage was removed (Fig. 2A and B). These “flickers” were accompanied by only modest changes in the whole-cell current, which are not visible on the scale in Fig. 2A. The brightness of the transients decreased sideways from their center, consistent with expectations of Ca2+ entry through a narrow pore, followed by its diffusion radially (Fig. 2A, insets). A step to -240 mV produced the first transient that was accompanied by a nanoampere current surge and persisted through the remainder of the experiment We attribute such long-lived transients to the formation of persistent electropores 54. Still larger voltage steps increased the number of persistent pores, and the net pore conductance increased proportionally, by 5-7 nS per pore. With still larger voltage steps producing multiple lesions, the “spillover” of Ca fluorescence could not be reliably distinguished from the formation of new Ca entry sites, so most data analyses for this paper were performed with smaller voltage steps that created the minimal number of pores.
–
FIGURE 2: Electropermeabilization by hyperpolarizing voltage steps. (A) Simultaneous monitoring of the whole-cell current and Ca2+ fluorescence in a cell subjected to voltage steps from -80 to -380 mV, in 20-mV increments (top plot). All steps are 25-ms long and applied at 350-ms intervals. Net pore conductance (center) is corrected for the series resistance, as described in the Methods and Fig. 3. Insets show sample Ca2+ transients in pseudocolor, to highlight their brightness reduction radially from the center (yellow to green). Bars are 1 µm. Fluorescence was measured in regions of interest (ROIs) where distinct Ca2+ transients were detected. Traces of fluorescence in all ROIs are overlapped in the bottom plot in (A), with shading applied to the area under a trace. The numbers above the traces are counts of persisting Ca2+ transients. (B) Same fluorescence traces plotted separately for each ROI. The red horizontal lines perpendicular to the time axis mark the voltage steps. For clarity, the time is clipped to 4.5 s. In addition to short- and long-lived Ca2+ transients, note in ROIs 1 and 2 subtle fluorescence fluctuations, concurrent with voltage steps and starting already at -100 mV. See text for more details. |
Fig. 2B shows the peak fluorescence intensity at the locations of all transients recognized in this cell. Once a transient was noticed, a small region of interest (ROI, 1.36 µm diameter, 305 pixel area) was placed over its brightest region. The peak intensity of the transient was measured as the mean of the pixel values in the ROI; the average value from the images prior to the first voltage step was taken as 100%. The peak intensity of the fluorescence transients was expectedly higher during voltage steps than between them. This was caused by possible pore enlargement by ion flows 55 and/or by a larger driving force for Ca2+ entry at more negative TMPs. Pore formation kinetics are analyzed in more detail in the next sections.
In addition to the short- and long-lived fluorescence transients, we observed small brightness fluctuations that occurred synchronously with low-voltage steps, starting at just (-100) – (-120) mV, e.g., in ROIs 1 and 2 in Fig. 2B. These low-threshold, low-intensity “scintillae” could not be discerned by a visual examination of images and were discovered accidentally in ROIs placed over focal Ca2+ transients triggered by more negative voltage steps. Although the scintillae barely exceeded the background noise, their coincidence with the voltage steps warranted a detailed analysis provided below.
Adaptive increase in membrane conductance and the TMP limit
In the voltage clamp mode, current is injected through the pipette until the induced potential equals the command voltage. The induced potential is divided between the cell membrane resistance (Rm) and the series resistance (Rs) of the pipette. In intact cells, Rm is much greater than Rs (800-1,500 Mohm compared to 5-15 Mohm), so the voltage drop across Rs is negligible and the induced TMP closely matches the command voltage. When Rm is reduced by electroporation and the current is high, the voltage drop across Rs (VRs) may substantially diminish the induced TMP and needs to be considered 56, 57. The actual TMP reached is determined by subtracting the VRs from the command voltage. We found that VRs increases with increasing voltage steps, while the TMP remains remarkably constant, reaching its limit at approximately -260 mV (Fig. 3A).
–
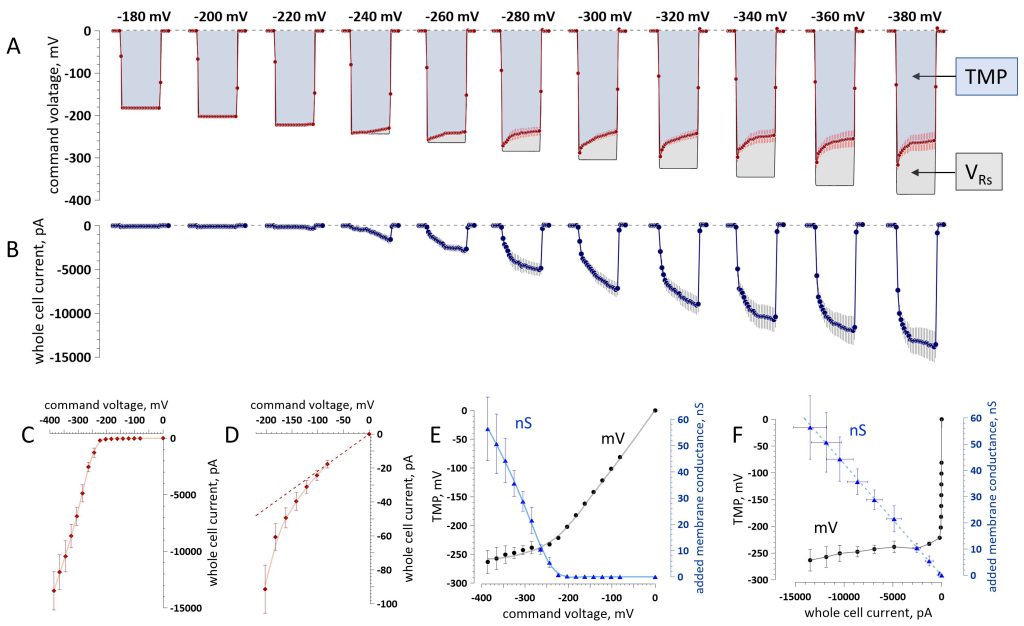 |
FIGURE 3: The adaptive conductance increase in electroporated cells prevents the transmembrane potential (TMP) build-up. (A) Larger command voltage steps (labeled above them, mV) increase the voltage drop over the series resistance (VRs), while the TMP stabilizes at a limit near -260 mV. (B) Whole-cell current recorded during the steps shown in (A). (C) Effect of the command voltage on the whole-cell current. (D) Same data on a 150× expanded vertical scale. (E) Effect of the command voltage on the induced TMP, mV (left scale, black symbols), and on the added membrane conductance, nS (right scale, blue symbols). Note the linear TMP increase at low and intermediate voltages and approaching a limit at larger voltages. (F) Effect of the whole-cell current on the TMP, mV (black symbols, left axis) and added membrane conductance, nS (blue symbols, right axis). Note a steep TMP dependence on current near zero (below the threshold for persistent electropores) replaced by just a minimal dependence on the current in the nanoampere range (when persistent electropores formed). Also note the linear increase in the added membrane conductance. In all the graphs, shown are mean values ± s.e. for n = 7. The measurements in graphs C–F are at 20 ms into the voltage steps. Solid lines in C-E are the data fits with a locally estimated scatterplot smoothing (LOESS) nonparametric regression. |
The whole-cell current was stable and relatively small (<200 pA) during voltage steps of up to -220 mV. Larger steps, which caused the opening of persistent pores, induced a sharply larger current which kept increasing during the steps (Fig. 3B). Current strength, TMP, and membrane conductance values measured at 20 ms into the step are presented in Fig. 3C-F. The slope of the current-voltage dependence increased abruptly at -240 mV (Fig. 3C), matching the threshold for the emergence of persistent Ca2+ transients. The first signs of electropermeabilization could in fact be observed at -100 mV as a deviation from the linearity of the current‒voltage curve (Fig. 3D). The membrane conductance increased in an adaptive manner, effectively “clamping” the TMP at -260 ± 24 mV (Fig. 3E). The additional membrane conductance resulting from electropermeabilization was proportional to the whole-cell current. When the current increased, the membrane conductance also increased, so the induced TMP did not change (Fig. 3F).
This unexpected phenomenon of dynamic pore conductance accommodation that prevented TMP build-up warranted its confirmation in other cell types and under different conditions. The experiments illustrated in Fig. 4 focused specifically on the TMP and membrane conductance during and after electroporation, which was achieved in the whole-cell mode by a 200-ms voltage ramp down to -300 or -350 mV. Intra- and extracellular solutions were formulated without the fluorescent dye or channel inhibitors, with K+ and Na+ as the main cations. The membrane conductance in the range from -80 to 60 mV was tested by a voltage step protocol twice before the ramp and at 10, 30, and 60 s after it.
–
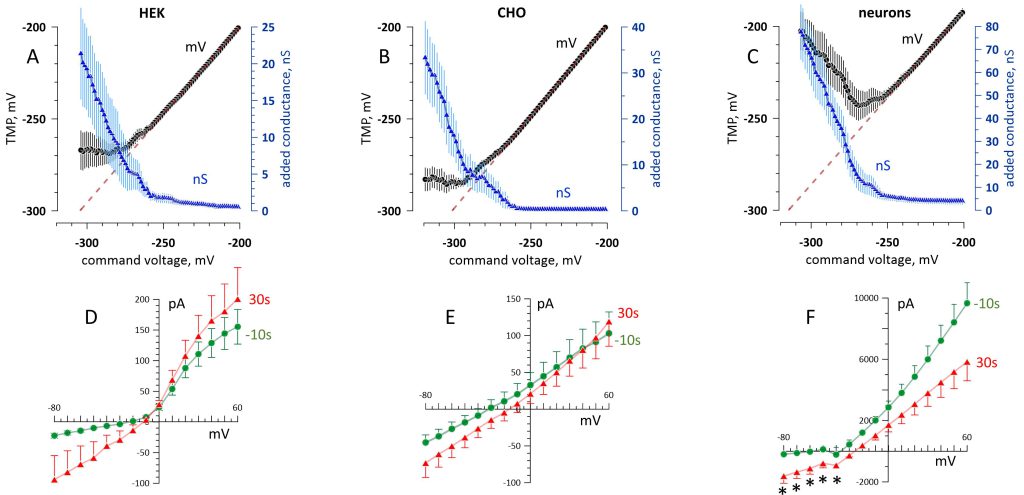 |
FIGURE 4: The adaptive conductance increase (A-C) and post-electroporation recovery (D-F) in three cell types. Cells of different origins (labeled above the graphs) were hyperpolarized beyond the electroporation threshold by 200-ms voltage ramps. (A-C) Effect of the command voltage on the induced TMP, mV (left scale, black symbols) and on the added membrane conductance, nS (right scale, blue symbols). The initial portion of the ramps (above -200 mV) is just linear and is not shown. The dashed lines are the linear fits through the TMP range before electroporation. (D-F) Current-voltage data recorded in the same cells 10 s prior to the electroporation and 30 s after it. Shown are mean values ± s.e. for n = 9 (HEK and CHO cells) and n = 6 (neurons). * p<0.02 (two-sided t test) between pre- and post-electroporation measurements; for all datapoints without labels, p>0.05. See Fig. 3 and text for more detail. |
These experiments, performed in HEK and CHO cells and in primary rat hippocampal neurons, consistently showed a TMP plateau or even depolarization after reaching the hyperpolarized TMP limit. The most hyperpolarized TMP, as measured at the beginning of the plateau (in HEK and CHO cells; Fig. 4A and B) or at the lowest point (in neurons; Fig. 4C), averaged -270 ± 6 mV, -284 ± 5 mV, and -243 ± 9 mV, respectively. Three HEK cells (out of twelve) did not reach the electroporation point and were not included in the analysis. Neurons were prone to “overreacting” to electroporation, increasing the membrane conductance more than necessary to prevent further hyperpolarization. Imposing command voltages below -243 ± 9 mV caused depolarization instead of a plateau, resulting in a U-shaped dependence (Fig. 4C).
The prevention of TMP build-up came at the cost of increasing the membrane conductance into the tens of nanosiemens range (Fig. 4A-C). Remarkably, it did not destroy the membrane: All the cells gradually recovered, and the current‒voltage curves recorded just 30 s after electroporation were similar to those before it (Fig. 4D‒F). In HEK and CHO cells, the whole-cell conductance reduced from its peak value during the ramp more than 20-fold in 30 s, and the currents measured during individual voltage steps were not significantly different from their pre-electroporation values (p>0.05, two-sided t test). In neurons (Fig. 4F), the whole-cell conductance in the range from -80 to -50 mV (no voltage-gated channels activated) reduced 3-fold from its peak value during the ramp and remained larger than in intact cells (p<0.02). Measurements taken at more depolarized membrane potentials predominantly recorded the voltage-activated outward K+ current, with the initial 10-15 ms of the voltage step skipped to exclude fast Na+ currents. The reduced conductance above -20 mV could be caused by the inhibition of K+ channels by electroporation 58, 59.
Of note, the electropore conductance in HEK cells during the voltage ramp (Fig. 4A) was lower than with the step protocol (Fig. 3E). The difference was significant at -240 mV (1.4 ± 0.5 nS for the ramp versus 5.5 ± 2 nS for the steps, p<0.05, two-sided t test) and at -260 mV (3.3 ± 1.2 nS versus 10.4 ± 1.8 nS, respectively, p<0.01). This difference is likely related to more time allowed by the steps for pore opening and maturation (see below), although the different composition of the bath and pipette solutions could have contributed as well.
Delayed and abrupt emergence of long-lived electropores
Averaged traces of the whole-cell current in Fig. 3B show a gradual increase throughout the duration of each step to -240 mV and beyond. However, the traces in individual cells displayed abrupt changes, which were concealed by averaging.
For example, the cell in Fig. 5A maintained a small and steady current of about 160 pA for the first 8 ms of a voltage step to -260 mV. At 8 ms, the current abruptly increased 10-fold to ~2 nA, coinciding with the appearance of a single fluorescence spot of Ca2+ entry. It marked the emergence of a large electropore with a high conductance of 7.8 nS. After a 10-ms plateau, the current surged to 3 nA, and the Ca2+ transient became larger and brighter. This change could reflect an abrupt widening of the electropore that increased its conductance to 10.7 nS. Alternatively, the transient could have enhanced due to a local Ca2+ accumulation (if its influx was faster than radial diffusion from the pore), whereas the surge in current was due to the opening of another pore. Indeed, a second Ca2+ transient appeared in the last image taken during the voltage step (the 6th frame in Fig. 5A), but it was 10-fold dimmer than the first one and could unlikely account for the current surge to 3 nA. This second transient stayed for a single frame duration after the voltage step (i.e., <10 ms), while the first transient persisted through the rest of the experiment.
–
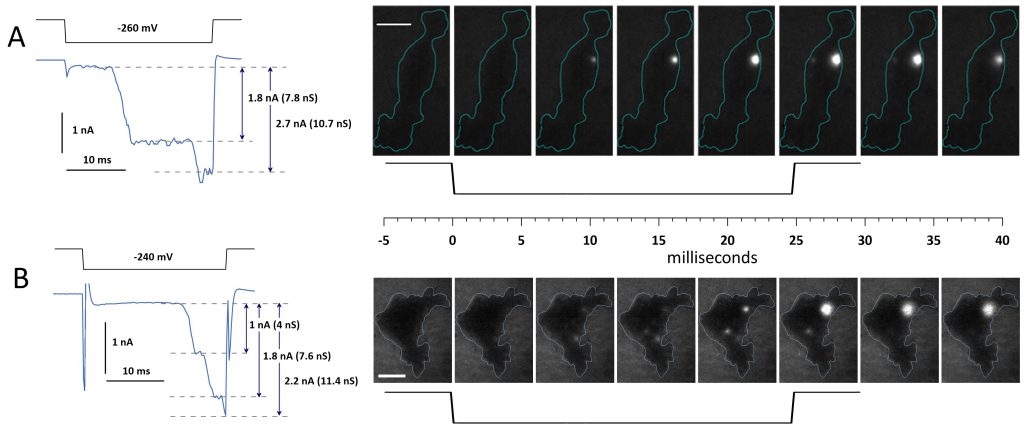 |
FIGURE 5: Changes in the whole-cell current and Ca2+ transients during the formation of a persistent electropore. (A and B), two representative cells responding to a 25-ms hyperpolarization from 0 to -260 mV (A) and to -240 mV (B; black traces). Stepwise increments of the whole-cell current (blue traces underneath) parallel the formation of bright spots of Ca2+ fluorescence in TIRF images. Legends in the graphs show the amplitude of the current increments between the dashed lines (nA) and the respective whole-cell conductance increments (nS). The images were taken every 5.65 ms before, during, and after the voltage step shown underneath. Blue contours emphasize the cell boundary. Bar: 10 µm. See text for more details. |
The cell in Fig. 5B exhibited more complex pore formation. It maintained a steady 180 pA current for the initial 16 ms of a voltage step to -240 mV. During this time, two and then three small Ca2+ transients appeared. Starting at 16 ms, the current surged in three abrupt steps to 1.17, 2.0, and 2.4 nA, corresponding to conductance increases of 4, 7.6, and 11.4 nS, respectively. Concurrently, one of the Ca2+ transients disappeared, and two others intensified. One of them was short-lived, lasting only a single frame post-step, while the other one briefly grew brighter and remained until the experiment’s end. Although these observations allow for different interpretations, they corroborate a delayed and abrupt pattern of emergence of long-lived electropores and their nanosiemens-range conductance.
The formation of short-lived electropores
The emergence of short-lived electropores was accompanied by just modest increases in the whole-cell current, close to the resolution limit of the measurements. Fig. 6 illustrates two methods that were employed to estimate the conductance of a single short-lived electropore: from fluctuations in the current during a voltage step (Fig. 6A; same approach as in Fig. 5) and from the current-voltage curve as the difference in the chord conductance 56 from the preceding voltage step which did not open the pore (Fig. 6B). For a single pore that formed at -220 mV (Fig. 6C), these methods yielded comparable conductance values of 216 and 170 pS, respectively.
–
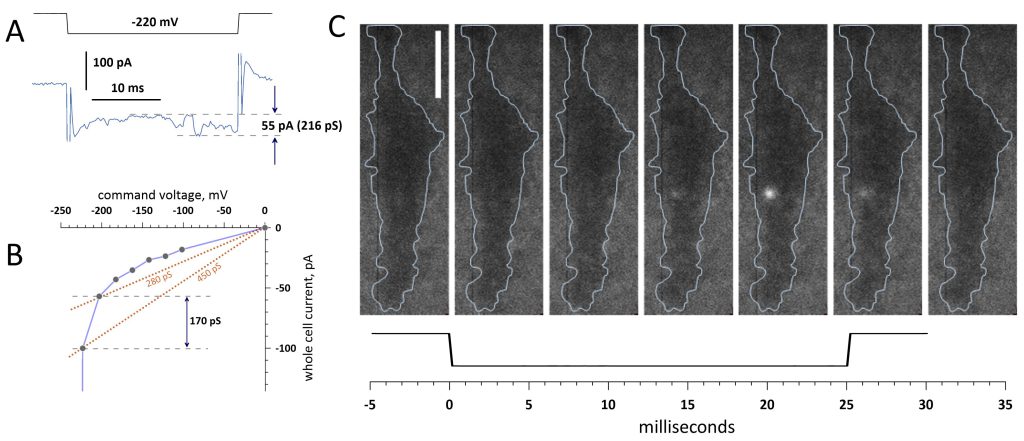 |
FIGURE 6: Changes in the whole-cell current and conductance measurements of a short-lived electropore. (A) Current recorded during a -220 mV voltage step in a representative cell. Fluctuations marked by dashed lines coincide with the appearance of a single fluorescence transient and correspond to a 216-pS conductance change. (B) Estimation of the same pore conductance using a whole-cell current−voltage curve. The chord conductance at -200 mV (no fluorescence response) was 280 pS. At -220 mV it became 450 pS and a single fluorescence spot formed. The difference of 170 pS is assumed to result from the pore formation. Currents were measured at 20 ms into the voltage step. (C) Consecutive TIRF images (left to right, 5.65 ms/frame) taken before, during and after the step to -220 mV shown underneath. The blue contours emphasize the cell boundary. Bar: 10 µm. See text and Fig. 5 for more details. |
Measurements in other cells and using both methods generated single-pore conductance values ranging from tens to about 300 pS. For example, single pore formation at -200 mV in the cell shown in Fig. 1B was not accompanied by any significant current fluctuations during the voltage step. The pore conductance measured from the current‒voltage curve (data not shown) was 73 pS. The current increase from the opening of two pores by a step to -220 mV was 24 pA, corresponding to a conductance change of 106 pA, or 50-60 pS per pore. Measurements using the current voltage curve yielded 215 pS for the two pores. However, considering that the pore opened by the previous voltage step to -200 mV did not re-open, a more accurate estimate of the conductance of the two pores would be 288 pS (215+73 pS), or about 150 pS per pore. The variability of the numbers can be explained by the limited resolution of the whole-cell measurements, by the intrinsic variability of the electropore diameter and conductance, and by the pore conductance dependence on the TMP 55.
Low-threshold, low-intensity, short-lived diffuse zonal electropermeabilization (ZEP)
The unexpected observation of subtle fluorescence upticks (scintillae), which coincided with voltage steps and started at just -100 mV (Fig. 2B, ROIs 1 and 2), prompted further analysis of this phenomenon. Although small (<5%), these upticks were not artifacts due to electrical interference affecting the camera (in which case they would have appeared in all ROIs). The scintillae were not unique to the cell in Fig. 2B but could be observed in other cells with a proper ROI placement. Since the scintillae were not discernible by visual analysis of the images, ROIs had to be positioned by trial and error: they were dragged across the cell image until the upticks in a real-time plot of pixel intensity became best separated from the noise. The same trial-and-error procedure was employed to position the negative control ROIs which would not display any upticks coinciding with voltage steps. Fig. 7A and B display a cell with eight large ROIs (3.35 µm diameter, 2,090 pixel area) placed along the cell’s footprint, and the respective traces of fluorescence on 10x different signal intensity scales. Scintillae at -100 mV and larger voltage steps were identified in four out of eight ROIs in different parts of the cell. ROIs with scintillae did not form a contiguous zone and were separated by a region without them. We tried to better isolate scintillae from the noise by fine tuning the ROI size, shape, and position, as well as by signal filtering, but these manipulations were only minimally effective. With any of the ROI settings, scintillae remained within 2-5% above the background and did not present any brighter central spots, such as in Ca2+ flickers shown in the insets of Fig. 2A. The membrane disruption that caused scintillae was diffuse, could cover a large portion of the cell membrane, and was not accompanied by the formation of detectable focal lesions. Therefore, it was regarded as diffuse zonal electropermeabilization (ZEP) without electropore formation (or our TIRF detection lacked the sensitivity to discern pores).
–
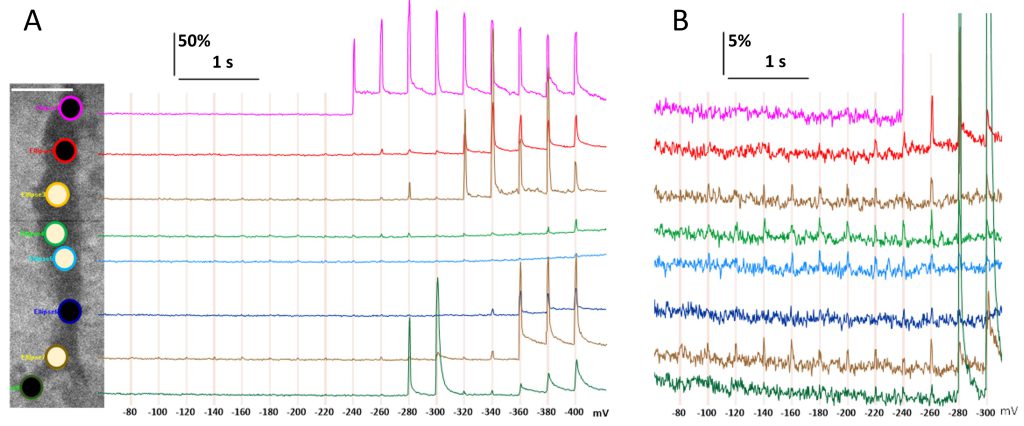 |
FIGURE 7: Low-threshold zonal electropermeabilization (ZEP) revealed by fluorescence scintillae coincident with voltage steps. (A) A sample cell subjected to sequential voltage steps from -80 to -400 mV (see Fig. 2A and Methods for details). The image shows the cell’s footprint (darker area) with selected regions of interest (ROIs). Bar: 10 µm. Pixel intensity was averaged across each ROI, normalized to its mean value prior to the first voltage step (F/F0 x 100%), and plotted over time. The color of each fluorescence trace matches the outline of the respective ROI. The voltage steps are marked by vertical grid lines with legends underneath, mV. The white- and black-filled ROIs are those where ZEP was and was not observed, respectively. (B) Same data presented on a 10× expanded vertical scale to emphasize ZEP occurrences. |
Scintillae did not necessarily become brighter with more negative voltage steps, despite increasing the driving force for Ca2+ entry. Their amplitude stayed nearly constant (within the accuracy of measurements) through the range from -100 to -220 mV (Fig. 7B). The low-intensity, low-threshold scintillae did not predict the emergence of focal Ca2+ transients at the same location with larger steps. There was possibly even a negative correlation since both short- and long-lived transients tended to emerge first in regions where no scintillae had been observed (the topmost and the bottommost ROIs in Fig. 7A).
The whole-cell electric current increased nonlinearly starting from -100 mV (Fig. 3D), which is a key sign of electropermeabilization 56 and matched the threshold for scintillae. The gain in the whole-cell conductance responsible for the deviation from the linearity, as measured at 20 ms into a voltage step, was 22 ± 4 pS at -100 mV and increased to 115 ± 16 pS at -180 mV (n=7). Considering the lack of a concurrent change in the amplitude of scintillae, the voltage-dependent gain of the whole-cell conductance indicates the expansion of the permeabilized zone. It will require a detection method with a much better signal-to-noise ratio to determine if scintillae indeed appear over larger areas at more negative voltages.
DISCUSSION
Over the last decade, experiments using the whole-cell configuration of patch clamp have generated a wealth of knowledge about the cell membrane response to supraphysiological voltages. The milestone results include the TMP thresholds for electroporation 56, 60; dynamic measurements of membrane conductance 16, 55, 61, 62, 63; loss and recovery of resting TMP 16; inward rectification and cation selectivity of the electroporated membrane 55, 60, 64, 65, 66; inhibition of electroporation by lanthanides 44, 55, 63, 67; involvement of TRPC and NALCN channels 67; and the distinction between transient and persistent membrane damage 61. Our study advanced to TIRF imaging concurrent with electrical monitoring to dynamically characterize the membrane response with a single-lesion resolution.
Previous studies of electroporation in plant and mammalian cells reported current‒voltage relationships characterized by an abrupt transition from low to high membrane conductance between 200 and 300 mV of either de- or hyperpolarization, which was regarded as the threshold for electroporation 56, 60, 61, 64. Consistent with these studies, we observed the abrupt conductance increase at (-240 mV) – (-280) mV (Figs. 3C, E and 4A-C). We also found that this transition results from the formation of just one or two long-lived, high-conductance pores. However, the actual threshold of electroporation was at (-180) – (-200) mV, when one or several short-lived electropores could already be observed. The emergence of two types of pores differing in threshold, lifetime, conductance, and often forming at different locations on the membrane could explain the short- and long-lived electropermeabilization effects reported previously 61. On the other hand, the agreement with the earlier studies is only partial, since the long-lived permeabilization required repetitive hyperpolarizations or a single step beyond the voltage that caused the abrupt increase in conductance. This and some other inconsistencies could result from the different compositions of the intra- and extracellular solutions used. Specifically, in experiments involving TIRF imaging, the extracellular solution contained 10 mM Ca2+ (to increase the driving force for Ca2+ entry and facilitate the detection of membrane lesions) contrasting only 0.1 mM Ca2+ in the previous work 61. We also replaced K+ and Na+ with tetraethylammonium+ and Cs+, to minimize currents through endogenous voltage-gated channels in case if any are expressed and activated. These ions also have a lower water mobility and are less permeant through electropores 55, 64, thereby reducing conductance readings for the permeabilized membrane state.
Another distinction from the previous patch clamp studies was the TMP limit reached at (-240 mV) – (-280) mV (Figs. 3 and 4A-C). It contrasted the conductance limit reported at approximately the same TMP 56, 68. The authors called this a “completely porated” membrane state and were able to hyperpolarize cells down to -500 mV without further conductance increase. In our experiments, any attempt to polarize the membrane beyond the TMP limit increased pore conductance, preventing TMP build-up, an effect that matches chronopotentiometry findings in model lipid bilayers 41. Increased whole-cell conductance was achieved with no or minimal opening of additional pores. Instead, the already present pores became more conductive and some of the transient pores transformed into high-conductance persistent pores. This was manifested by brightening of fluorescence transients with a small or no increase in their number. For example, out of 23 transients discerned in the cell in Fig. 2B, only three small transients were elicited as “new” by steps larger than to -260 mV. More research is needed to establish whether the transformation from short-lived pores into persistent pores occurs via pore aperture widening or includes more complex restructuring. The discrete conductance steps in persistent pores (Fig. 5) support their complex structure and could also constitute the mechanism of stepwise upsurges in whole-cell conductance 56.
Electropermeabilization can be defined as the emergence of currents in excess of what is predicted by a linear extrapolation of the current‒voltage relation from the physiological TMP 56. While a nonlinear increase in current was already observed in the range from -100 to -200 mV, it was under 100 pA and was dwarfed by the abrupt upsurge to nanoamperes at more negative voltages (Fig. 3C and D). This minute nonlinearity of the inward current would have been ignored if not accompanied by fluorescence upticks, which led us to the discovery of ZEP and shifted the electropermeabilization threshold to the border of physiological TMP at -100 mV. The emergence of ZEP under physiological conditions, its exact mechanism and significance for cell function have yet to be investigated. We can hypothesize that ZEP constitutes the first line of defense against further charging to a potentially damaging TMP by (a) admitting cations and depolarizing the TMP and (b) by admitting Ca2+, which is the universal key signal for initiating membrane repairs 4, 69, 70.
The terms “electroporation” and “electropermeabilization” are often used interchangeably (although the former is a specific case of the latter) or even contrasted with one another to emphasize that the long-lasting permeabilized state is due to mechanisms other than pores, such as looser packing of oxidized phospholipids 20, 48. Ironically, we show the opposite dependence, when the diffuse electropermeabilization is short-lived, while electropores can persist for a long time 54. These observations are not exclusive of other membrane disruption mechanisms, especially with ultra-short, high-voltage external electric pulses, but rather emphasize the complexity of electropermeabilization as an umbrella term for diverse mechanisms. We did not establish any link between ZEP and locations where focal electropores emerged at larger voltages, which suggests that these effects are independent. Similarly, there was no strict correlation between the locations where short- and long-lived Ca2+ transients emerged. Some short-lived transients emerged only at threshold voltages and never re-appeared in the same place at higher voltages; others “skipped” one or several voltage steps before re-appearing at the initial spot (Fig. 1B and C); and still others consistently emerged in the same spot at every voltage step (Fig. 2B). Much brighter, high-threshold persistent transients could be preceded by short-lived transients (e.g., ROIs 1, 4, 11, and 22 in Fig. 2B), but could also emerge at “virgin” locations (e.g., ROIs 9 and 10 in Fig. 2B). Such unpredictable behavior suggests that weak permeabilizations, both ZEP and short-lived low-conductance pores, may protect against more severe damages at the same spot. Plausible mechanisms of protection include the inflow of cations, which would reduce the TMP locally and hinder the transformation of a small lesion into a highly conductive persistent pore, as well as prompt activation of Ca2+-dependent membrane repairs. These mechanisms can be validated in future studies with TIRF imaging using TMP-sensitive fast fluorophores 71 and Tl+ 45 or Ba2+ 72 instead of Ca2+ for electropore detection.
In lipid bilayer studies, exceeding a critical TMP causes irreversible destabilization and rupture of the bilayer 1, 2, 32. We have not observed cell rupture in any of our experiments, possibly because the adaptive change in membrane conductance (Figs. 3 and 4A-C) prevented TMP build-up to the critical level. The opening and enlargement of electropores never destroyed the membrane and could potentially be regarded as a cell defense mechanism. Severely electroporated cells may eventually die from a variety of downstream effects, such as Ca2+ overload and colloid-osmotic swelling 5, 13, 14, but membrane disintegration as a direct and immediate effect of the electric field is unlikely.
Our study identified and characterized three different types of electropermeabilization, with different thresholds, time courses, and impacts on membrane conductance. It remains to be explored whether electropermeabilization involves any chemical modifications, what is the role of membrane proteins and structural components of the cell, and how the integrity of electroporated membranes is restored. It should also be noted that our findings are limited to patch clamp conditions, specific formulations of intra- and extracellular media, and relatively long millisecond-range electric pulses. Field stimulation with nanosecond-duration, high-voltage electric pulses may elicit yet unknown permeabilization phenomena.
MATERIAL AND METHODS
General methods were the same as described recently 54. Voltage stimulation protocols and data analyses have been modified to fit the study goals.
Cells
Most experiments were performed in human embryonic kidney cells (HEK 293), a preferred model for studies of electroporation mechanisms thanks to their low expression of voltage-gated ion channels 4, 73, 74, 75. HEK cells were obtained from the American Type Culture Collection (ATCC, Manassas, VA). and propagated at 37°C with 5% CO2 in air, in EMEM medium (Mediatech Cellgro, Herdon, VA) supplemented with 10% fetal bovine serum (FBS; Atlanta Biologicals, Norcross, GA), 100 IU/ml penicillin, and 0.1 mg/ml streptomycin (Gibco, Gaithersburg, MD). The day before experiments, the cells were seeded onto customized glass-bottomed 35-mm Petri dishes (MatTek, Ashland, MA). The dishes were fabricated using 15-mm diameter glass coverslips covered with ITO to a sheet resistance of 8–12 Ohm/sq by Diamond Coatings Ltd. (Halesowen, UK) 50. For experiments which did not involve TIRF imaging (Fig. 4), cells were seeded on dishes without the ITO coating.
The experiments presented in Fig. 4 also involved Chinese hamster ovary cells (CHO-K1, ATCC) and dissociated E18 rat hippocampal neurons (BrainBits, Springfield, IL). CHO cells were grown in Ham’s F12K medium (Mediatech Cellgro) with the same supplements and same handling as for HEK cells. Neurons were prepared as described recently 76. They were seeded on 12-mm glass coverslips coated with poly-d-lysine and laminin (Corning, Corning, NY) and incubated at 37°C in 5 % CO2 in Gibco neurobasal medium supplemented with 20 ml/l of B-27, 2.4 ml/l of GlutaMAX (Thermo Fisher Scientific, Waltham, MA), and 25 μM L-glutamic acid (Sigma‒Aldrich, St. Louis, MO). Half of the medium was replaced every 3–4 days, omitting L-glutamic acid. The neurons were used between 14 and 30 days in culture.
All experiments described in this study involved two or more batches of cells used on different days.
Electrophysiology and electropermeabilization protocols
A whole-cell patch clamp configuration was established in cells attached to coverslips and placed on the stage of an Olympus IX83 inverted microscope (Olympus America, Center Valley, PA). The Multiclamp 700B amplifier and Digidata 1550B digitizer were controlled by Clampex 10.7 software (Molecular Devices, San Jose, CA). Pipettes were pulled from borosilicate glass (BF150-86-10, Sutter Instrument, Novato, CA), fire polished, and positioned using a ROE-200 manipulator (Sutter Instrument, Novato, CA). The pipette series resistance (Rs, typically 4-10 Mohm) was measured immediately prior to data recording by the Membrane Test utility of Clampex.
In all the experiments with TIRF imaging, the ground lead of the amplifier headstage was set to touch the ITO layer. The bath solution was composed of (in mM) 136 tetraethylammonium chloride (TEACl), 2 MgCl2, 10 CaCl2, 10 HEPES, and 10 glucose. The pipette solution contained (in mM) 20 TEACl, 130 CsCl, 10 HEPES, 4 Mg-ATP, 10 Cs-EGTA, and 0.12 of the fluorescent Ca2+ indicator CAL-520. Electropermeabilization was achieved by the voltage step protocol shown in Fig. 2A. It consisted of 16 steps, 25 ms each, applied at 350-ms intervals. The step voltage was escalated from -80 to -380 mV in 20-mV increments; between the steps, the cells were held at 0 mV.
In the experiments without TIRF imaging (Fig. 4), the bath buffer was composed of (in mM) 140 NaCl, 5 KCl, 2 MgCl2, 2 CaCl2, 10 HEPES, and 10 glucose. Pipettes were filled with a solution containing (in mM) 5 NaCl, 140 KCl, 1 MgCl2, 1 CaCl2, 3 EGTA, and 10 HEPES. The cells were held at -50 mV (CHO and HEK) or at -80 mV (neurons). The stability of the whole-cell configuration was validated by running a voltage-step protocol (15 steps, 25 ms duration, from -80 to 60 mV) twice with a 30 s interval. Currents were measured as the average value during the last 10-15 ms of the step. When voltage-activated currents were present, this time interval corresponded to a plateau of the outward K+ current while avoiding most or all of the early inward Na+ current.
All the chemicals used were obtained from Sigma‒Aldrich, except for EGTA (Thermo Fisher Scientific) and CAL-520 (AAT Bioquest, Pleasanton, CA). All the solutions were adjusted to a pH of 7.3 and had the osmolality of 300-310 mOsm/kg.
Induced TMP and conductance calculations
The induced TMP at time t into a voltage step or during the voltage ramp was corrected by subtracting the voltage drop across the series resistance (VRs) from the command voltage Vclamp 56, 57:
TMP(t) = Vclamp – VRs(t) = Vclamp – I(t) × Rs,
where I(t) is the whole-cell current at time t. As shown in Fig. 3B, this correction became more significant as the voltage steps increased and the cell membrane became increasingly more conductive. Similarly, the TMP achieved during voltage ramps was essentially equal to the command voltage until the electroporation threshold was reached (Fig. 4A-C).
Cell conductance was measured as “chord conductance,” Gchord(t) = I(t)/TMP(t) 56, 57. Using the “slope conductance” (the first derivative of the current-voltage curve) was avoided, as it would yield erroneous values when the conductance changed during a voltage step. The smallest voltage step, from 0 to -80 mV, evoked no membrane permeabilization, so the respective chord conductance was considered a leak (Gleak). The net membrane conductance added by electropermeabilization (Figs. 3E, F and 4A-C) was the Gchord(t) value after the subtraction of Gleak. The added conductance in experiments with ramps (Fig. 4) was calculated in the same manner, considering the average conductance at the holding potential as Gleak.
The conductance of a single electropore (Gpore) was calculated using two approaches, both aimed at comparing the whole-cell conductance when a membrane lesion was and was not detected by concurrent fluorescence imaging. In the first approach (Figs. 5 and 6A), a single pore appeared during a voltage step, so there were periods during this step when the current was small (no pore yet) and when it upsurged to a certain level (pore opened). Then, the pore conductance could be calculated as:
Gpore = (IA – IB)/Vclamp
where IA and IB are the time-averaged currents during the voltage step after and before the upsurge, respectively (horizontal dashed lines in Fig. 5). When several upsurge steps were observed, the same calculation was performed for each of them. When the exact pore emergence time was uncertain, as with most transient, low-conductance pores (Fig. 6A), the conductance was calculated between the lowest and the highest currents measured during the step but avoiding the regions affected by capacitance transients.
The second approach derives the pore conductance as the difference in the whole-cell conductance between the voltage step that opened the pore, and the preceding step that did not. The conductance was measured at a moment late into the voltage step when the pore presumably had already opened. The procedure is illustrated in Fig. 6B, where the chord conductance at 20 ms into the voltage step was 280 pS at -200 mV and increased to 450 pS at -220 mV when a single pore was detected by imaging. The difference of 170 pS was assigned to the pore conductance. If two pores were detected simultaneously, the measured conductance could be divided between them proportionally to the brightness of the respective fluorescence transients.
Both employed approaches are prone to overestimating the single-pore conductance if other pores or diffuse defects developed concurrently but were missed by TIRF imaging. A good match between the time when fluorescence transients emerged or changed their brightness with the upsurges in the whole-cell current suggests that such errors were unlikely.
Fluorescence imaging
Ca2+-dependent fluorescence was detected in TIRF mode using a cellTIRF MITICO unit (Olympus), a 100x, 1.5 NA UPLAPO100XOHR Olympus objective, an Orca Flash 4.0 V.3 sCMOS camera (Hamamatsu, Bridgewater, NJ), and a 488 nm excitation laser (Coherent, Santa Clara, CA), controlled with cellSens 2.3 software (Olympus). The fluorescence intensity in all the images was far below the camera saturation limit (fewer than 4,000 levels on a scale of 64,000 levels). Images were taken in a streaming mode at a rate of 5.65 ms/frame. The timed acquisition of image stacks was synchronized with patch clamp protocols using an Olympus U-RTCE Real-Time Controller and cellSens interface.
Stacks of 1200 images per experiment were analyzed using MetaMorph 7.7 (Molecular Devices). Except for the ZEP analyses in Fig. 7, all fluorescence transients were identified and marked with circular ROIs of uniform size (21-pixel diameter, 305-pixel area; 1 pixel = 64.92 nm). ROIs were centered over the brightest part of each transient. The average pixel intensity within each ROI, representing Ca2+ transient’s peak intensity, was measured across the entire image stack. It was normalized to the baseline, calculated as the average intensity in images captured before the first voltage step.
In cases like Fig. 7, where low-intensity fluorescence scintillae were visually indistinct, we began with a standard-sized ROI and dragged it across the image, monitoring the real-time average pixel intensity plot of the image stack. Upon noticing regular fluorescence upticks in the graph, we fine-tuned the ROI’s size, shape, and position to enhance separation from the background noise. This approach was also applied to place negative control ROIs, ensuring that they showed no upticks corresponding with voltage steps.
REFERENCES
For full bibliography please see the pdf.
ACKNOWLEDGMENTS
The study was supported in part by NIH NEI R21EY034258 and R21EY034803 (to AGP).
COPYRIGHT
© 2024

Dynamics of cell membrane lesions and adaptive conductance under the electrical stress by Silkunas et al. is licensed under a Creative Commons Attribution 4.0 International License.