Back to article: Cold exposure reinstates NAD+ levels and attenuates hepatocellular carcinoma
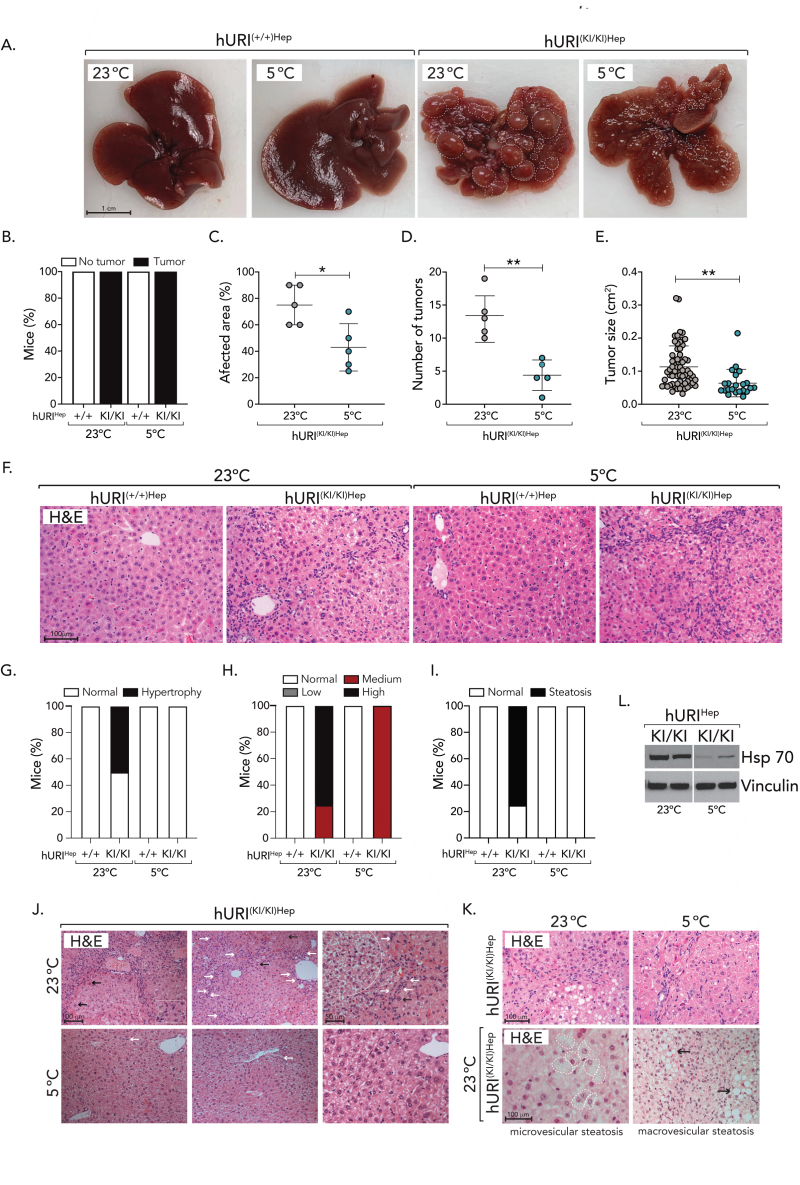
FIGURE 3: Long-term cold exposure attenuates HCC development. (A) Representative images of livers from mice exposed to RT (23±1◦C) or CT (5±1◦C). White dashed lines highlight regenerative nodules. (B) Percentage of hURIHep mice bearing liver tumors. (C-E) Macroscopical characterization of liver tumors, representing (C) percentage of affected area, (D) number of tumors, and (E) tumor size in hURIHep mouse livers exposed to RT (23±1◦C) or CT (5±1◦C). (F) Representative H&E stainings from liversof hURIHep mice exposed to RT or CT. (G-H) Microscopical quantification of the percentage of hURIHep mice presenting (G) hepatocytehypertrophy and (H) oval cell hyperplasia, based on liver tissues from (F). (I) Microscopical quantification of the percentage of hURIHep mice presenting steatosis based on liver tissues from (F). (J) Representative H&E staining’s from hURI(KI/KI)Hep mice livers. White arrows highlight oval cell hyperplasia and black arrows highlight anisokaryosis. White dashed lines highlight cholestasis, while the white circle shows a nodule with clear cells. (K) Representative H&E staining’s from hURI(KI/KI)Hepmice livers highlighting steatosis. White dashed lines highlight hepatocytes with microvesicular steatosis and black arrows show macrovesicular steatosis. (L) Western blot analysis of hURIHep mouse livers exposed to RT or CT. Statistical analysis was performed using unpaired two-tailed Student’s t-test. Data are represented as mean ± s.e.m from n independent experiments; *P≤ 0.05, **P ≤ 0.01. Scale bars, 50 µm and 100 µm(F, J,K), and 1 cm (A).

