Back to article: Neuroglobin-enriched secretome provides neuroprotection against hydrogen peroxide and mitochondrial toxin-induced cellular stress
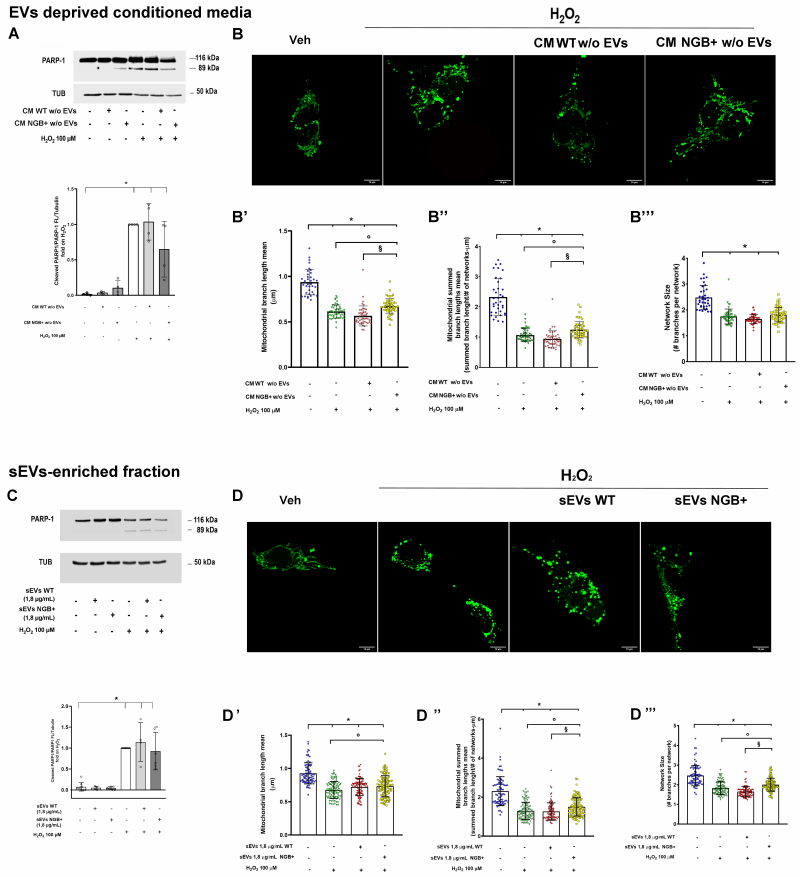
FIGURE 3: Effect of EVs- deprived CM and sEVs on H2O2 induced cell death and mitochondrial disruption. The level of PARP-1 cleavage was evaluated by Western blot in SH-SY5Y cells pre-treated (4 h) with CM deprived from EVs fraction generated by SH-SY5Y WT (CM WT w/o EVs) or NGB overexpressing cells (CM NGB+ w/o EVs) before the stimulation with H2O2 (100 µM; 24 h) (A). Representative Western blot (top) and relative densitometric analyses (bottom) are reported. Confocal microscopy representative images of mEFP-mitochondria SH-SY5Y cells (SH-SY5Y mito-mEFP) treated with Vehicle or with H2O2 (100 µM) for 4 h in presence or absence of 4 h pre-treatment with CM WT w/o EVs or CM NGB+ w/o EVs (B). Mitochondrial branch length mean (B’), summed branch lengths mean (B”) and mean network size (mitochondrial branches per network) (B”’) were quantified using the Mitochondrial Network Analysis tool (MiNA). Western blot analysis of PARP-1 cleavage was performed in SH-SY5Y treated with H2O2 (100 µM; 24 h) in presence or absence of pre-treatment with sEVs collected from WT cells (sEVs WT) or NGB-overexpressing cells (sEVs NGB+) at a single dose (1,8 µg/mL) (C). Representative Western blot (top) and relative densitometric analyses (bottom) are reported. Representative confocal images of SH-SY5Y with green marked mitochondria (SH-SY5Y mEFP mitochondria) pre-treated with sEVs WT or sEVs NGB+ (1,8 µg/mL; 4 h) before H2O2 (100 µM; 4 h) stimulation (D). The measure of mitochondrial branch mean length (D’), summed branch mean length (D”) and mean network size (D”’) are reported. For Western blot analysis, the levels of cleaved PARP-1 were normalized to the full-length PARP-1 and tubulin levels on the same filter. Representative blots and densitometric analysis were obtained from at least four independent experiments. For the analysis of mitochondrial morphology, about 60 cells from three independent experiments were analyzed. Data shown are means ± SD. In all cases, statistical significance was determined with ANOVA followed by Tukey-Kramer post-test vs CTRL condition (*), vs H2O2 condition (◦) or vs treatment with H2O2 and CM WT (§).

