Back to article: Neuroglobin-enriched secretome provides neuroprotection against hydrogen peroxide and mitochondrial toxin-induced cellular stress
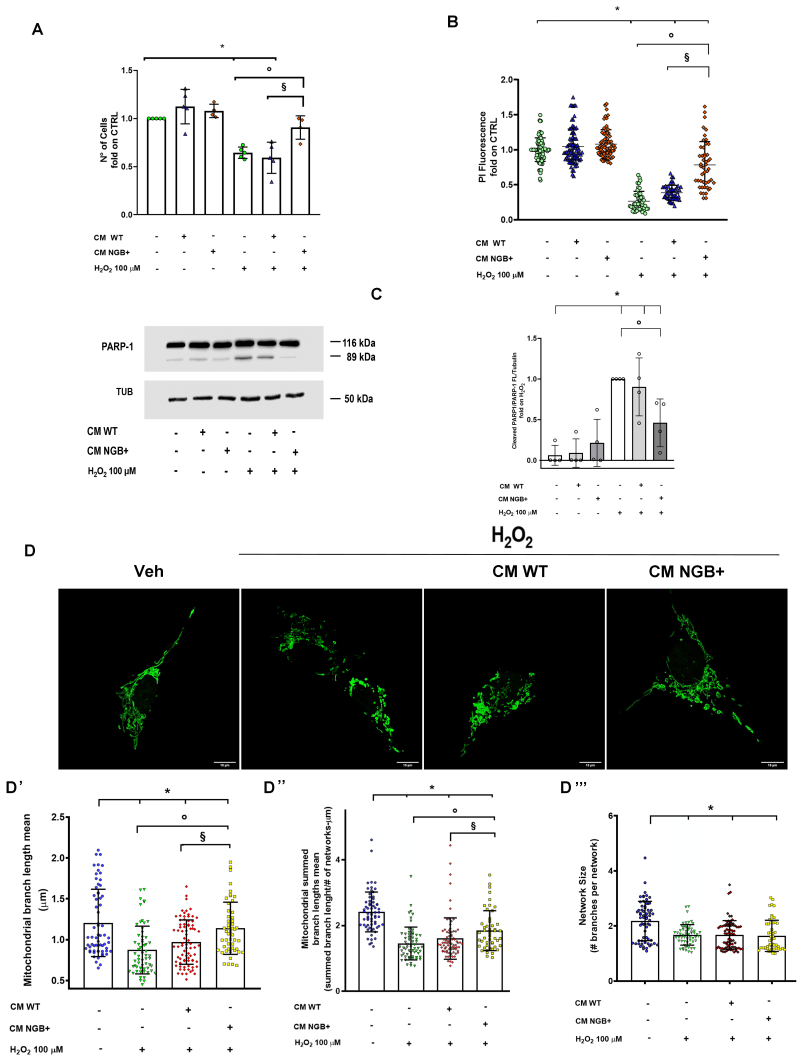
FIGURE 2: Effect of NGB-enriched CM on H2O2 induced stress. The analysis of cytotoxicity on SH-SY5Y cells under the 24 h stimulation with H2O2 (100 µM) in presence of pre-treatment (4 h) with CM obtained from WT cells (CM WT) or from NGB-HA overexpressing cells (CM NGB+) was performed by both viable cell counting (A) and by the analysis of cell DNA content obtained by propidium iodide assay on fixed and permeabilized cells (B). At the same experimental condition, the PARP-1 cleavage was evaluated by Western blot (C). The levels of cleaved PARP-1 were normalized to the full-length PARP-1 and tubulin levels on the same filter. Representative blot (left) and densitometric analysis (right) were obtained from at least four independent experiments. Representative image obtained by confocal microscopy showing mitochondrial networks in mEFP-mitochondria SH-SY5Y cells (SH-SY5Y mito-mEFP) treated with Vehicle or with H2O2 (100 µM) for 4 h in presence or absence of 4 h pre-treatment with CM from WT SH-SY5Y (CM WT) or NGB-HA overexpressing SH-SY5Y (CM NGB+) (D). Mitochondrial morphology features including the branch length mean (D’), summed branch lengths mean (D”) and mean network size (network branches mean) (D”’) were quantified using the Mitochondrial Network Analysis tool (MiNA) on confocal microscopy acquired images. Data shown are means ± SD from ~ 60 cells from 3 independent experiments. In all cases, statistical significance was determined with ANOVA followed by Tukey-Kramer post-test vs CTRL condition (*), vs H2O2 condition (◦) or vs treatment with H2O2 and CM WT (§).

