Back to article: Stress granules formation in HEI-OC1 auditory cells and in H4 human neuroglioma cells secondary to cisplatin exposure
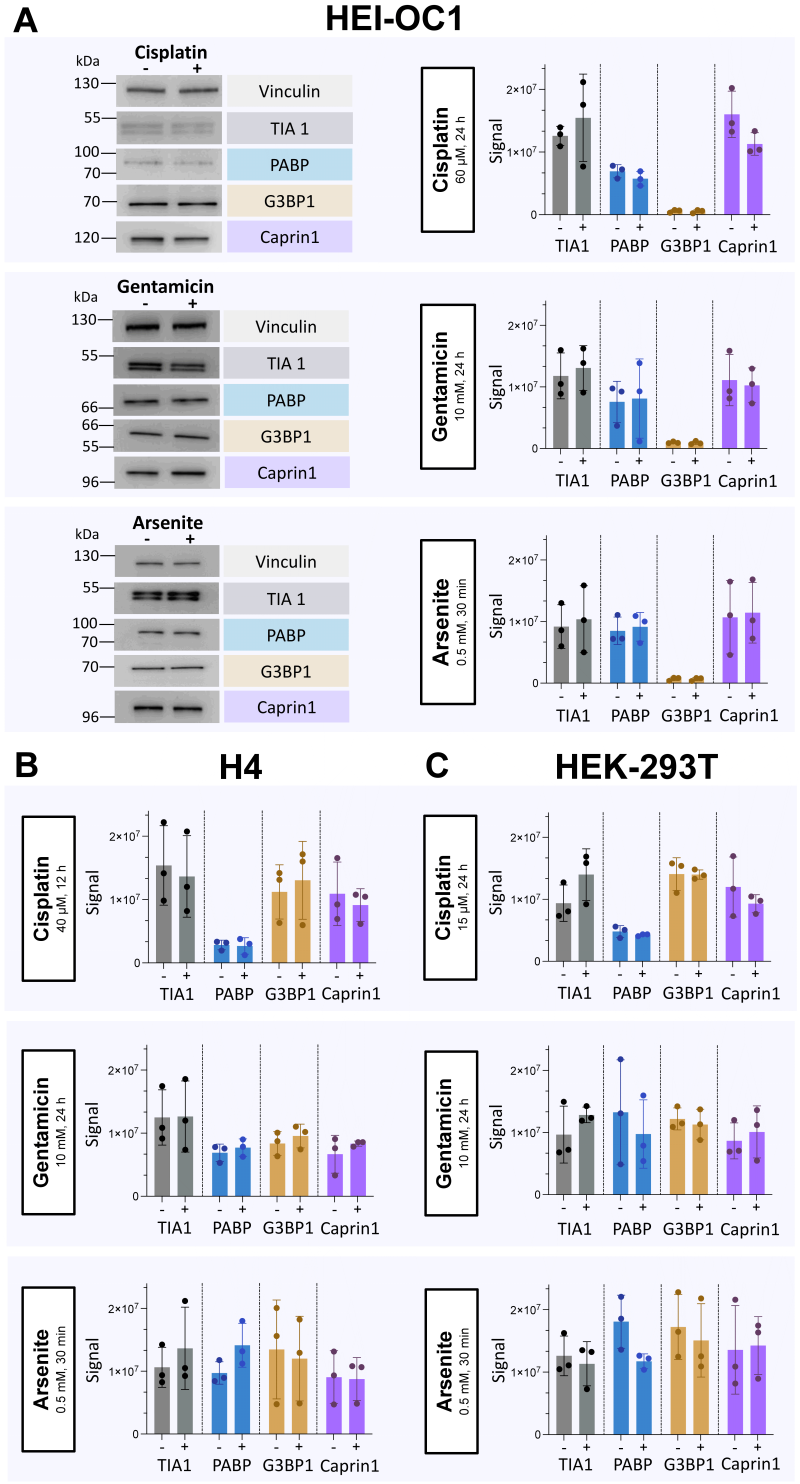
FIGURE 5: Detection of protein markers for SG formation in HEI-OC1, H4 and HEK-293T cells by SDS-PAGE immunoblot . Cell lysates (20 µg) of HEI-OC1, H4 and HEK-293T cells were subjected to SDS-PAGE after 12 or 24 h incubation with cisplatin or 24 h gentamicin, in comparison to 30 min of exposure to arsenite. After transfer, membranes were incubated with antibodies targeted against TIA1, PABP, G3BP1, and Caprin1, followed by incubation with an HRP-conjugated secondary antibody. Incubation with anti-Vinculin antibody served as loading control. Immunoblots were repeated three times as independent experiments. (A) HEI-OC1 cells incubated with 60 µM cisplatin for 24 h, 10 mM gentamicin for 24 h, or 0.5 mM arsenite for 30 min, compared to control. On the left, a specific section of the immunoblot membranes was selected to showcase untreated cells (-), versus cells subjected to treatment (+). On the right, the x-axis of the bar graphs represents the protein of interest on untreated cells (-), versus cells subjected to treatment (+), while the y-axis depicts the normalized protein signal with the mean ± SD. (B) H4 human neuroglioma cells incubated with 40 µM cisplatin for 12 h, 10 mM gentamicin for 24 h, or 0.5 mM arsenite for 30 min, compared to control. On the bar graphs, , the x-axis of the bar graphs represents the protein of interest on untreated cells (-), versus cells subjected to treatment (+), while the y-axis depicts the normalized protein signal with the mean ± SD. (C) HEK-293T cells incubated with 15 µM cisplatin for 12 h, 10 mM gentamicin for 24 h, or 0.5 mM arsenite for 30 min, compared to control. On the bar graphs, the x-axis of the bar graphs represents the protein of interest on untreated cells (-), versus cells subjected to treatment (+), while the y-axis depicts the normalized protein signal with the mean ± SD.

