Back to article: Stress granules formation in HEI-OC1 auditory cells and in H4 human neuroglioma cells secondary to cisplatin exposure
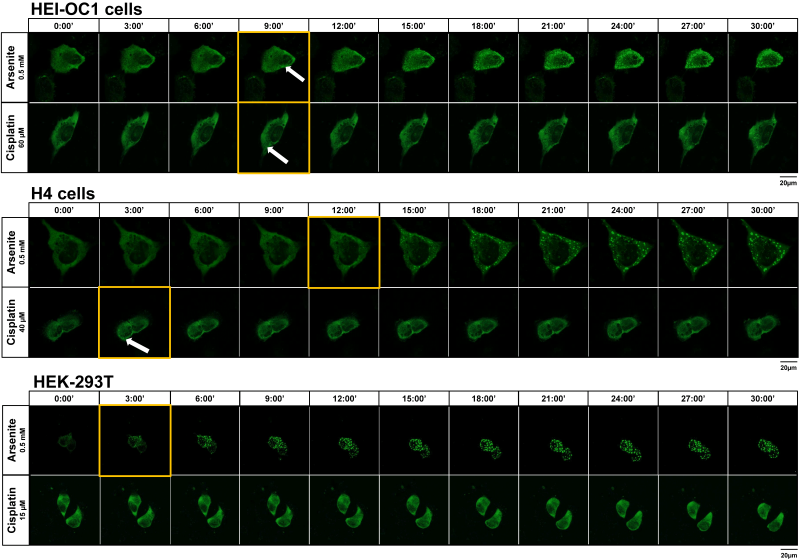
FIGURE 4: Live cell imaging of HEI-OC1, H4 and HEK-293T cells with the G3BP marker following treatment with cisplatin compared to arsenite. Live cell imaging captures from (A) HEI-OC1 auditory cells; (B) H4 human neuroglioma cells; and (C) Human embryonic kidney HEK-293T cells subjected to treatment with cisplatin or arsenite representing maximal projections images of z-stacks at 3-minute intervals. Timepoint 0 was established when the treatment was administered and lasted for at least 30 min. Live confocal imaging with Airyscan was performed with a confocal point-scanning microscope (Zeiss LSM 800) using a 1.4 UPlanSApo 100x oil objective. The scale bar is 20 µm. The arrows point to SGs with G3BP marker. The yellow frames mark the timepoint at which the stress granules first become visible.

