Back to article: Dynamics of cell membrane lesions and adaptive conductance under the electrical stress
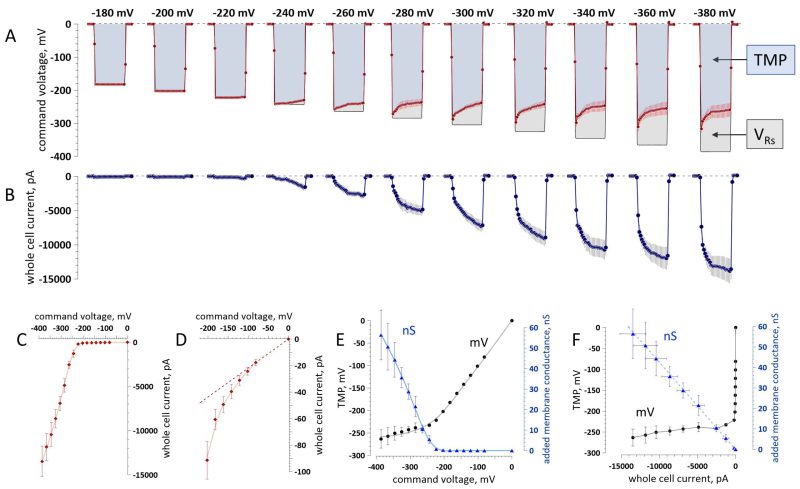
FIGURE 3: The adaptive conductance increase in electroporated cells prevents the transmembrane potential (TMP) build-up. (A) Larger command voltage steps (labeled above them, mV) increase the voltage drop over the series resistance (VRs), while the TMP stabilizes at a limit near -260 mV. (B) Whole-cell current recorded during the steps shown in (A). (C) Effect of the command voltage on the whole-cell current. (D) Same data on a 150× expanded vertical scale. (E) Effect of the command voltage on the induced TMP, mV (left scale, black symbols), and on the added membrane conductance, nS (right scale, blue symbols). Note the linear TMP increase at low and intermediate voltages and approaching a limit at larger voltages. (F) Effect of the whole-cell current on the TMP, mV (black symbols, left axis) and added membrane conductance, nS (blue symbols, right axis). Note a steep TMP dependence on current near zero (below the threshold for persistent electropores) replaced by just a minimal dependence on the current in the nanoampere range (when persistent electropores formed). Also note the linear increase in the added membrane conductance. In all the graphs, shown are mean values ± s.e. for n = 7. The measurements in graphs C–F are at 20 ms into the voltage steps. Solid lines in C-E are the data fits with a locally estimated scatterplot smoothing (LOESS) nonparametric regression.