Back to article: Dynamics of cell membrane lesions and adaptive conductance under the electrical stress
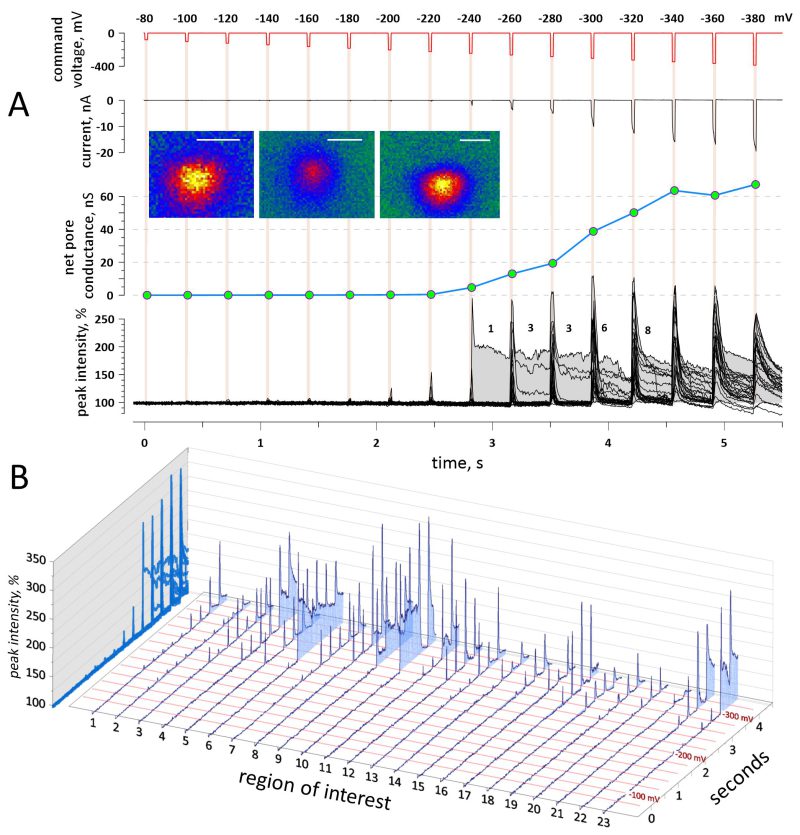
FIGURE 2: Electropermeabilization by hyperpolarizing voltage steps. (A) Simultaneous monitoring of the whole-cell current and Ca2+ fluorescence in a cell subjected to voltage steps from -80 to -380 mV, in 20-mV increments (top plot). All steps are 25-ms long and applied at 350-ms intervals. Net pore conductance (center) is corrected for the series resistance, as described in the Methods and Fig. 3. Insets show sample Ca2+ transients in pseudocolor, to highlight their brightness reduction radially from the center (yellow to green). Bars are 1 µm. Fluorescence was measured in regions of interest (ROIs) where distinct Ca2+ transients were detected. Traces of fluorescence in all ROIs are overlapped in the bottom plot in (A), with shading applied to the area under a trace. The numbers above the traces are counts of persisting Ca2+ transients. (B) Same fluorescence traces plotted separately for each ROI. The red horizontal lines perpendicular to the time axis mark the voltage steps. For clarity, the time is clipped to 4.5 s. In addition to short- and long-lived Ca2+ transients, note in ROIs 1 and 2 subtle fluorescence fluctuations, concurrent with voltage steps and starting already at -100 mV. See text for more details.