Back to article: Evaluation of I-TAC as a potential early plasma marker to differentiate between critical and non-critical COVID-19
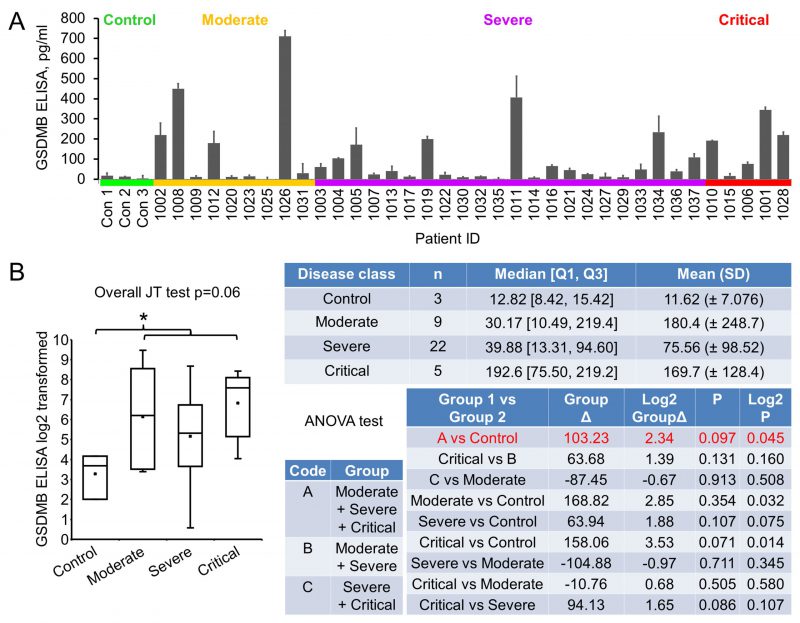
FIGURE 4: Gesdermin B expression in early plasma.(A) Plasma GSDMB levels were determined with ELISA. Plasma (50 µl) were diluted to 100 µl and added to anti- GSDMB coated wells in duplicate. Data were groups by disease stage and expressed as mean ± SD. (B) Statistical analysis of GSDMB levels with disease stages. Graph shows log2 transformation of the original values. Note that one original value in moderate group was 0, so the transformed meaningless value was removed, resulting in the decreased average compared to that in critical group. *, p<0.05 with ANOVA test. Δ, difference.