Back to article: Evaluation of I-TAC as a potential early plasma marker to differentiate between critical and non-critical COVID-19
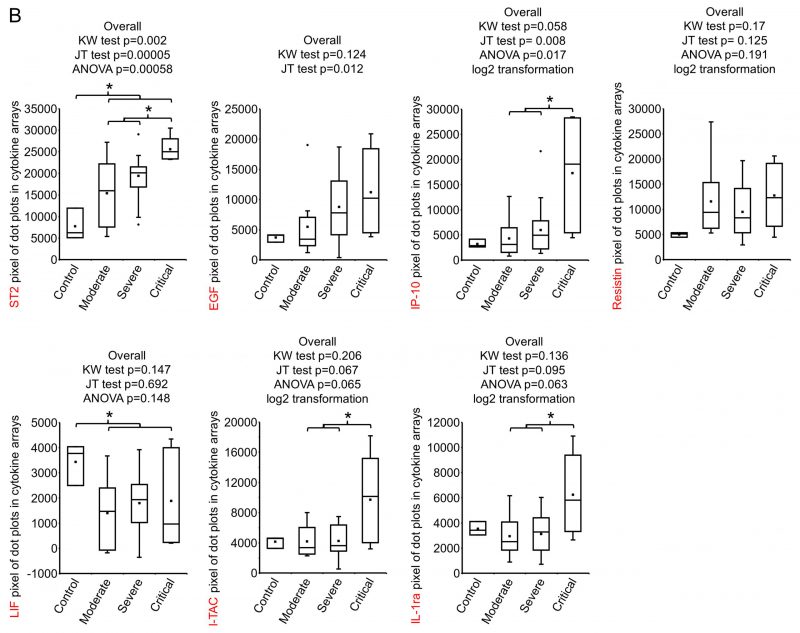
FIGURE 1: Screening of early plasma cytokines.(A) Human XL Cytokine Array Kits were used for cytokine screening. 20 μl plasma from each patient were diluted with 1.5 ml Array Buffer 6 and applied to one Cytokine Antibody Array Membrane. Blot images were quantified with Quick Spot image analysis software and normalization among batches of assays was done against positive controls. Shown is the expression heatmap of the cytokines. Cytokines were arranged according to the expression ratio of disease (moderate + severe + critical, n= 9 + 22 + 5 =36) to normal control (n=3). Numbers 1001-1017, 1019-1037 on the bottom: COVID-19 patient ID; Con: normal control. I-TAC and IP-10 on the left column are highlighted. (B) Cytokines whose expression ratio between disease and control or between critical and non-critical was higher than 2 or lower than 0.5 was subjected to statistical analysis. Raw values were tested for normality distribution. ST2 and LIF passed the test and ANOVA test were performed. Log2 transformation was made to the other five cytokines. IP-10, Resistin, I-TAC and IL-1ra passed the normality test and ANOVA test were performed using transformed values. EGF, as well as all other cytokines here, was subjected to non-parametric tests Kruskal-Wallis rank sum (KW) test to test overall difference among four groups and Jonckheere-Terpstra k-sample (JT) test to test if there is increasing or decreasing trend among the groups. *, p<0.05 with ANOVA test. The pairwise expression comparisons between disease and control or between critical and non-critical for EGF was done with Wilcoxon rank sum test and no significance reached

