Back to article: Development of novel methods that monitor necroptosis and the release of DAMPs at the single cell resolution
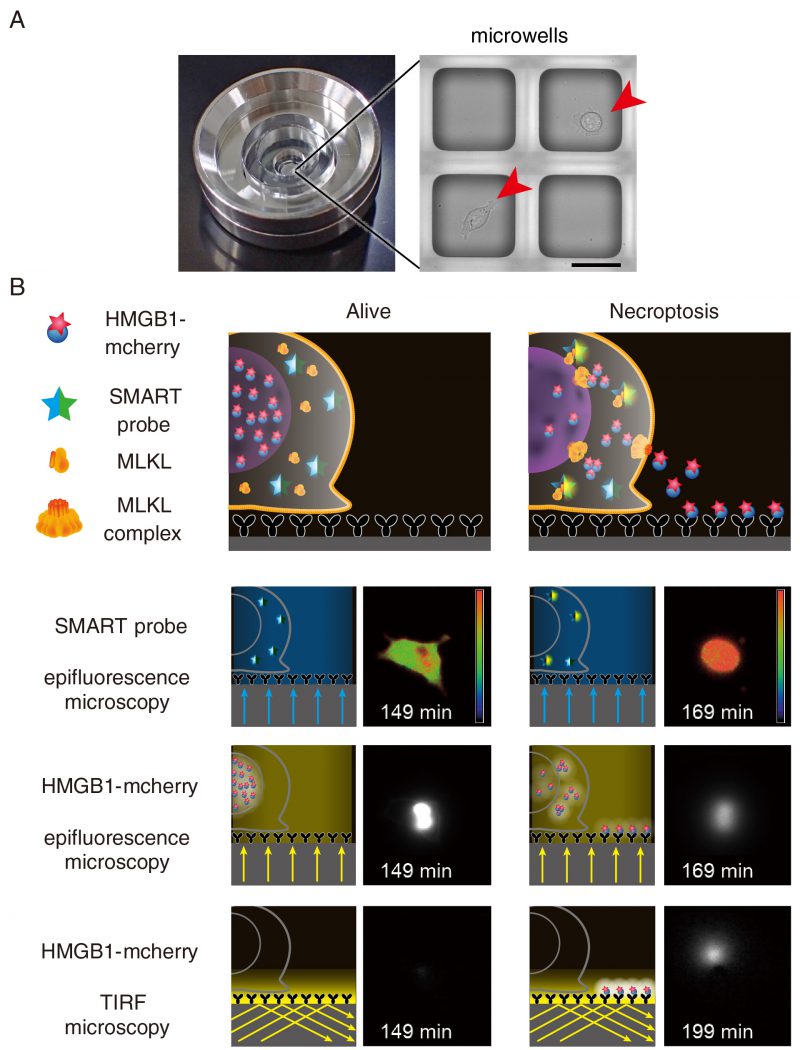
FIGURE 2: Detection of the release of HMGB1-mCherry using TIRF microscopy. (A) A single chamber well is composed of approximately 1,000 sub-nanolitre-sized microwells with 80 μm square in size where a single cell is seeded onto one microwell. Scale bars indicate 50 μm. Arrowheads indicate individual cell. (B) LCI-S monitors an increase in the FRET/CFP ratio of SMART, HMGB1-mCherry signals in the nucleus by epifluorescence microscopy, and released HMGB1-mCherry by TIRF-M. Microwells were precoated with anti-RFP antibody, and released HMGB1-mCherry was rapidly captured by anti-RFP antibody and was detected by TIRF-M. L929 cells were untreated (Alive) or treated with TNF and zVAD-fmk to induce necroptosis (Necroptosis). Fluorescent signals were analyzed at every 2 min and representative images of live and necroptotic cells are shown.