Back to article: LTX-315 sequentially promotes lymphocyte-independent and lymphocyte-dependent antitumor effects
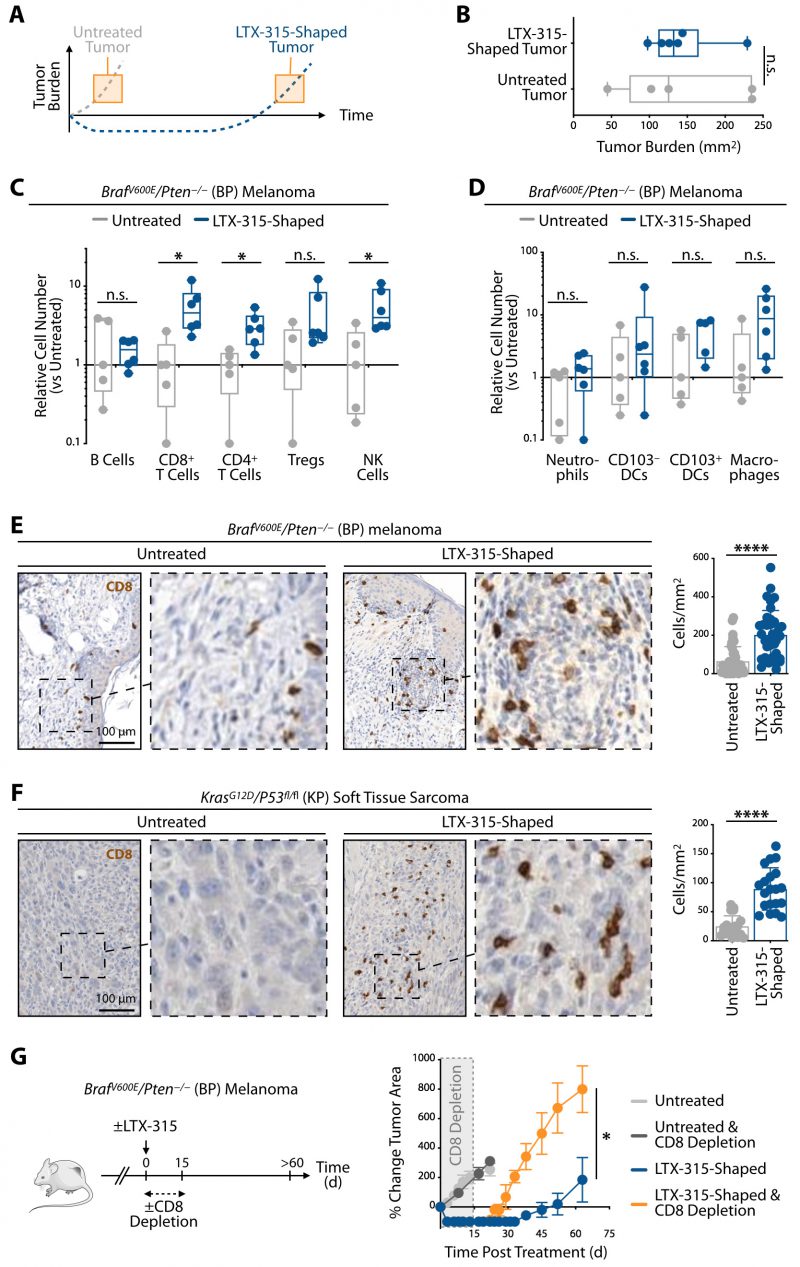
FIGURE 3: LTX-315's second phase of response is defined by long-term alteration of the tumor microenvironment including infiltration by antitumor CD8+ T cells. (A) Schematic of tumor growth curves of LTX-315 treated (blue) or untreated (grey) BrafV600E/Pten−/− mice (BP model). Orange boxes highlight equal tumor burden in both groups and indicate the time points when tumor immune infiltrates were analyzed. (B) BP tumor area of LTX-315-treated and control mice with equal tumor burden as highlighted in (A); n = 5 to 6 mice/group. (C) Ex vivo flow cytometry-based evaluation of lymphocytes in tumors of LTX-315-treated BP mice or untreated mice at time points defined in (A). Data were normalized to control tumor-bearing mice. n = 5 to 6 mice/group. (D) Same analysis as shown in (C) but focusing on intratumoral myeloid cells. n = 5 to 6 mice/group. (E) Representative CD8 antibody staining and quantification on BP tumor tissue sections of untreated or LTX-315-treated mice. Samples were prepared at time points highlighted in (A) Scale bar, 100 µm. n = 3 mice/group, with 4-30 fields of view analyzed. (F) Same analysis as presented in (E) on KrasG12D/p53fl/fl soft tissue sarcoma sections (KP model). Scale bar, 100 µm. n = 3-4 mice/group, with 10 fields of view analyzed. (G) Change in tumor area in either LTX-315-treated BP mice that received CD8 depleting antibodies for two weeks after drug injection or control mice (n = 3 to 6 mice/group). Results are expressed as mean ± SEM. *p < 0.05; ****p < 0.0001; n.s., not significant. Abbreviations are as follows: d = day.

