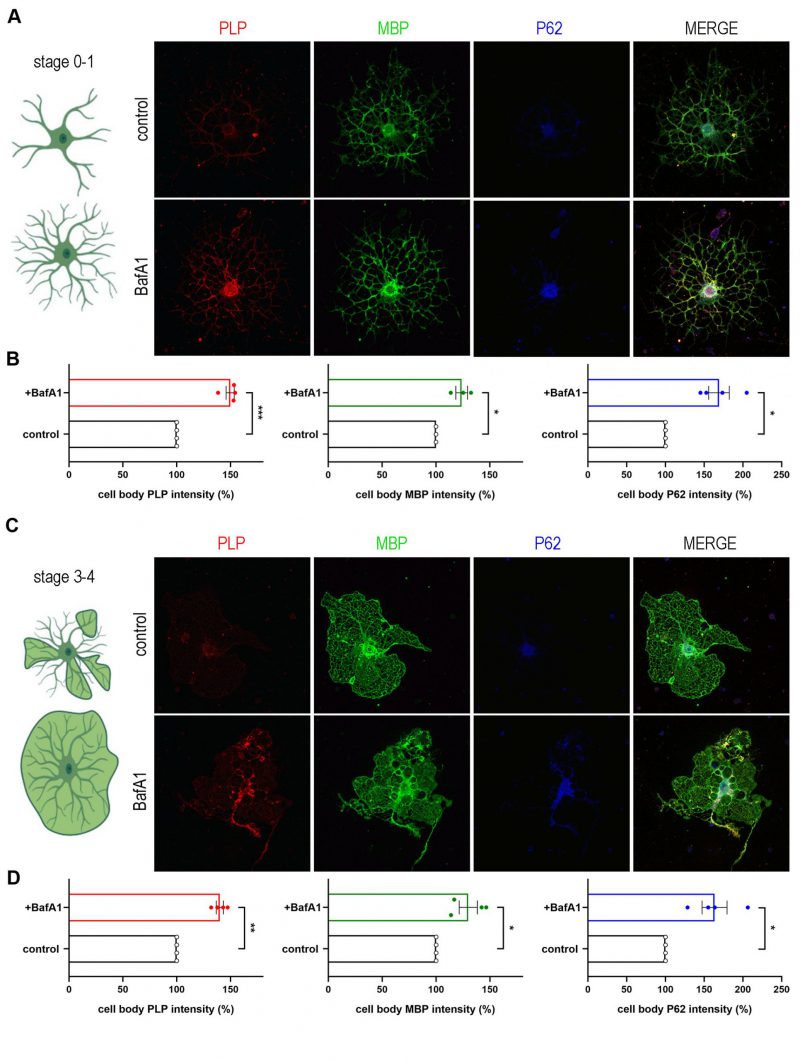
FIGURE 4: PLP and MBP constitute autophagic cargoes. A, C. Confocal images of DIV2 primary OLs, stage 0-1(A) and stage 3-4 (C), immunolabeled for PLP (red), MBP (green) and P62 (blue). Cells were either vehicle treated (control), or treated for 4 h with 10nM BafilomycinA1 (BafA1). B, D. Quantification of the normalized intensity levels of the above-mentioned proteins. Data information: Data are shown as mean ± SEM. N=4 independent experiments. 120-170 cells of stage 0-1 (B) and 40-50 cells of stage 3-4 (D) were used for the analysis. Student's t-test was used to determine statistical significance. *p < 0.05, **p ≤ 0.01, ***p ≤ 0.001. Scale bars: 30 μm.