Research Articles:
Cell Stress, Vol. 8, No. 1, pp. 83 - 98; doi: 10.15698/cst2024.10.299
Stress granules formation in HEI-OC1 auditory cells and in H4 human neuroglioma cells secondary to cisplatin exposure
1 University Medical Center Göttingen, Department of Experimental Neurodegeneration, Center for Biostructural Imaging of Neurodegeneration, Göttingen, Germany. 2 University Medical Center Göttingen, Department of Otolaryngology-Head and Neck Surgery, Inner Ear Lab, Göttingen, Germany. 3 Max Plank Institute for Multidisciplinary Sciences, Göttingen, Germany. 4 Translational and Clinical Research Institute, Faculty of Medical Sciences, Newcastle University, Newcastle upon Tyne, United Kingdom. 5 Scientific employee with an honorary contrat at Deutches Zentrum für Neurodegenerative Erkrankungen (DZNE)-German Center for Neurodegenerative Diseases, Göttingen, Germany.
Keywords: cisplatin, H4 cells, hearing loss, HEI-OC1 cells, ototoxicity, stress granules.
Abbreviations:
Caprin1 – cytoplasmic activation/proliferation-associated protein 1,
G3BP1 – Ras GTPase-activating protein-binding protein 1,
GFP – green fluorescence protein,
HEI-OC1 – House Ear Institute organ of Corti 1,
HEK – human embryonic kidney,
LLPS – liquid-liquid phase separation,
PABP – poly(A) binding protein,
RBP – RNA-binding protein,
RNP – ribonucleoprotein,
SG - stress granule,
TIA1 – T cell intracellular antigen 1.
Received originally: 17/02/2024 Received in revised form: 27/08/2024
Accepted: 04/09/2024
Published: 18/10/2024
Correspondence:
Cristian Setz, University Medical Center Göttingen, Department of Otolaryngology-Head and Neck Surgery, InnerEarLab, Göttingen, Germany; cristian.setz@med.uni-goettingen.de
Tiago F Outeiro, University Medical Center Göttingen, Department of Otolaryngology-Head and Neck Surgery, InnerEarLab, Göttingen, Germany; tiago.outeiro@med.uni-goettingen.de
Conflict of interest statement: The authors affirm that they have no conflicts of interest related to this work.
Please cite this article as: Hebatallah Abdelrasol, Avika Chopra, Liana Shvachiy, Dirk Beutner, Tiago F Outeiro, Cristian Setz (2024). Stress granules formation in HEI-OC1 auditory cells and in H4 human neuroglioma cells secondary to cisplatin exposure. Cell Stress 8: 83-98. doi: 10.15698/cst2024.10.299
Abstract
Stress granules (SGs) are highly dynamic micromolecular membraneless condensates that generate in cells subjected to stress. Formed from pools of untranslating messenger ribonucleoproteins (RNP), SGs dynamics constitute vital processes essential for cell survival. Here, we investigate whether established cytotoxic agents, such as the platinum-based chemotherapeutic agent cisplatin and the aminoglycoside antibiotic gentamicin, elicit SG formation in the House Ear Institute-Organ of Corti-1 (HEI-OC1) auditory cell line, H4 human neuroglioma cells and HEK-293T human embryonic kidney cells. Cells were treated with cisplatin or gentamicin for specific durations at designated concentrations. SG formation was assessed using immunocytochemistry and live cell imaging. Levels of essential proteins involved in SG assembly were evaluated using immunoblotting. We observed cisplatin-associated SG assembly in HEI-OC1 and H4 cells via confocal microscopy through antibody colabeling of G3BP1 with PABP or Caprin1. While maintaining an unchanged pattern of expression of main constituent SG proteins, cisplatin-related SGs in H4 cells persisted for at least 12 h after drug removal. Cells subjected to gentamicin exposure did not exhibit SGs. Our findings offer insights into subcellular mechanisms related to cisplatin-associated cytotoxicity, highlighting the need for future studies to further investigate this stress-response mechanism.
INTRODUCTION
Cellular stress is an inherent and inevitable aspect of cell physiology, prompting cells to adapt to environmental changes. Among the distinctive intracellular adaptive responses that have been characterized in intricate molecular detail in response to stress is the formation of stress granules (SGs) 1. SGs contain ribosome-unbound mRNAs along with translation initiation factors, specific RNA-binding proteins (RBPs), and proteins involved in cellular signaling pathways, forming mRNA-protein complexes (RNPs) 2, 3, 4. SGs are considered to originate through liquid-liquid phase separation (LLPS), a phenomenon that enables cells to locally sequester and confine specific molecules 5, 6, 7, 8. SGs hence constitute dynamic membraneless organelles that generate in cells subjected to stress 1, 9, 10.
SGs are part of a larger group of membraneless biomolecular condensates facilitated by LLPS, where RBPs specifically recognize unassociated mRNA regions, subsequently condensing to form assemblies of untranslating messenger RNPs 3, 11. Collectively termed RNP granules, they form a complex intracellular network crucial for maintaining basal cellular metabolism and homeostasis 12, 13. The majority of RNP granules are regular subcellular constituents found in the nucleus, such as the nucleolus, nuclear speckles, paraspeckles, and Cajal bodies 14, 15, as well as in the cytoplasm. Well-described constituent RNP granules in the cytoplasm include processing bodies, or P bodies, uridine-rich small nuclear RNP bodies, known as U bodies, and TIS granules, which are interconnected with the endoplasmic reticulum 16. Therefore, SGs are non-constitutive cytosolic RNP granules and thus temporary generated under strict micromolecular circumstances.
SGs have a stratified organization characterized by a dense core and active shell, facilitating continuous exchange of proteins and RNA with the cytoplasm 2, 10. The primary elements that determine SG assembly rely on intrinsic properties of RNA, as well as of Ras GTPase-activating protein-binding protein 1 (G3BP1), which serves as key regulator in SG assembly 17. The formation of SGs is characterized by the fusion of multiple smaller into fewer and larger foci, followed by their prompt disassembly upon stress alleviation in a dynamic interplay crucial for maintaining cellular homeostasis. Prolonged exposure to the stress factor that led to SG formation can result in aggregation of disease-related proteins within SGs, suggesting that abnormalities in SG turnover may contribute to various pathologies, including neurodegenerative diseases 18, 19, 20, 21, 22. Although the composition and assembly of SGs has been thoroughly studied, the specific molecular processes responsible for SG disassembly remain to be elucidated. The resolution of SGs has been described as a non-uniform controlled process involving the dissolution of the shell followed by the clearance of the core 23, 24. Transient SGs are dynamic rapidly removed, thereby reversing the LLPS by decondensation, while more stable SGs are cleared through the ubiquitination-proteasome system 25, 26 or via autophagy 1.
Our aim was to investigate whether established ototoxic agents, such as the platinum-based chemotherapeutic agent cisplatin and the aminoglycoside antibiotic gentamicin, elicit SG formation in the House Ear Institute-Organ of Corti-1 (HEI-OC1) auditory cell line, the H4 human neuroglioma cell line and HEK-293T human embryonic kidney cell line. All three cell lines were incubated with cisplatin or gentamicin at specific concentrations for a defined time period. Incubation with sodium arsenite (NaAsO2) was utilized as a positive control given its established action as a SG-inducer in multiple cell types 23.
In this study, we present evidence that demonstrates that cisplatin induces the assembly of SGs in HEI-OC1 auditory cells and H4 human neuroglioma cells, with the levels of proteins involved in SG assembly remaining largely unchanged. Alleviation experiments upon cisplatin removal in H4 cells showed persisting cisplatin-associated inclusions hours after stress relief. Gentamicin-associated cytotoxicity of HEI-OC1 auditory cells was not associated with SG assembly. Furthermore, our experiments demonstrate that treatment with cisplatin or gentamicin does not induce SG formation in HEK-293T human embryonic kidney cells. In conclusion, cisplatin was found to induce the intracellular SG stress response in HEI-OC1 auditory cells and H4 human neuroglioma cells, with H4 cells demonstrating no signs of SG clearance after cisplatin removal.
RESULTS
HEI-OC1 cells exposed to cisplatin exhibit the formation of SGs, while gentamicin causes blebbing of the cell membrane
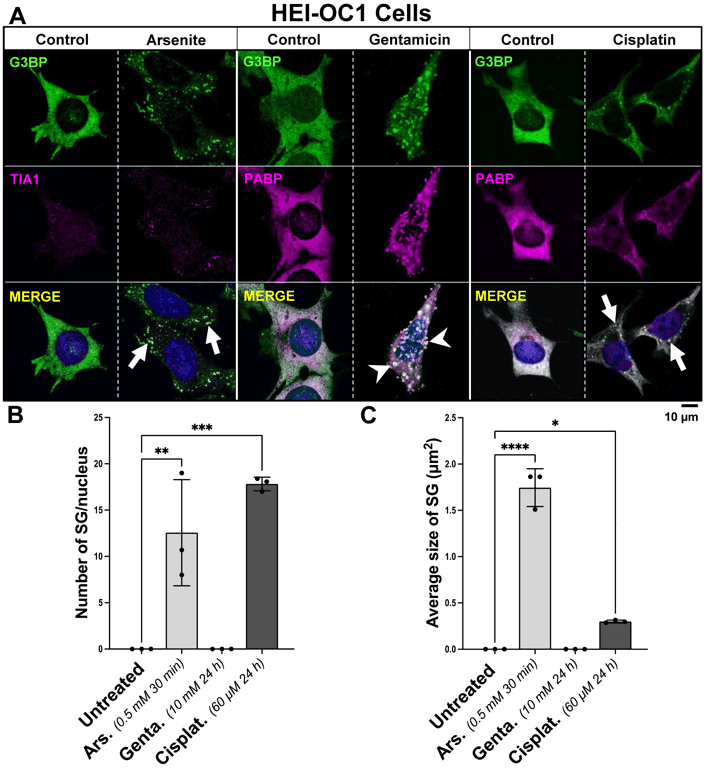
HEI-OC1 cells were incubated with 60 µM cisplatin or 10 mM gentamicin for 24 h, compared to vehicle control. As a positive control for SG formation, HEI-OC1 cells were incubated with 0.5 mM arsenite for 30 min, compared to vehicle control. Immunocytochemistry was performed targeting main SG protein markers G3BP, PABP or TIA1, showing SG formation after exposure to cisplatin (Fig. 1). No SGs were observed in control experiments (data not shown). Gentamicin did not trigger the formation of SGs. Alternatively, HEI-OC1 cells exposed to gentamicin generated blebbing of the cell membrane (Fig. 1A), whereas control experiments showed no blebbing of the cell membrane (data not shown).
–
HEI-OC1 cells incubated with cisplatin for 24 h generated on average 17.83 ± 0.733 SGs per cell, compared to vehicle-treated cells where no SGs were observed [p<0.001]. Exposure to arsenite for 30 min served as positive control for SG formation, with an average of 12.57 ± 5.733 SG per cell, compared to vehicle-treated cells where no SGs were observed [p<0.01] (Fig. 1B). The size of SGs formed after 24 h incubation with cisplatin exhibited an average size of 0.299 µm2 ± 0.015 [p<0.05], while the size of SGs formed after 30 min of incubation with arsenite exhibited an average size of 1.745 µm2 ± 0.204 [p<0.0001] (Fig. 1C).
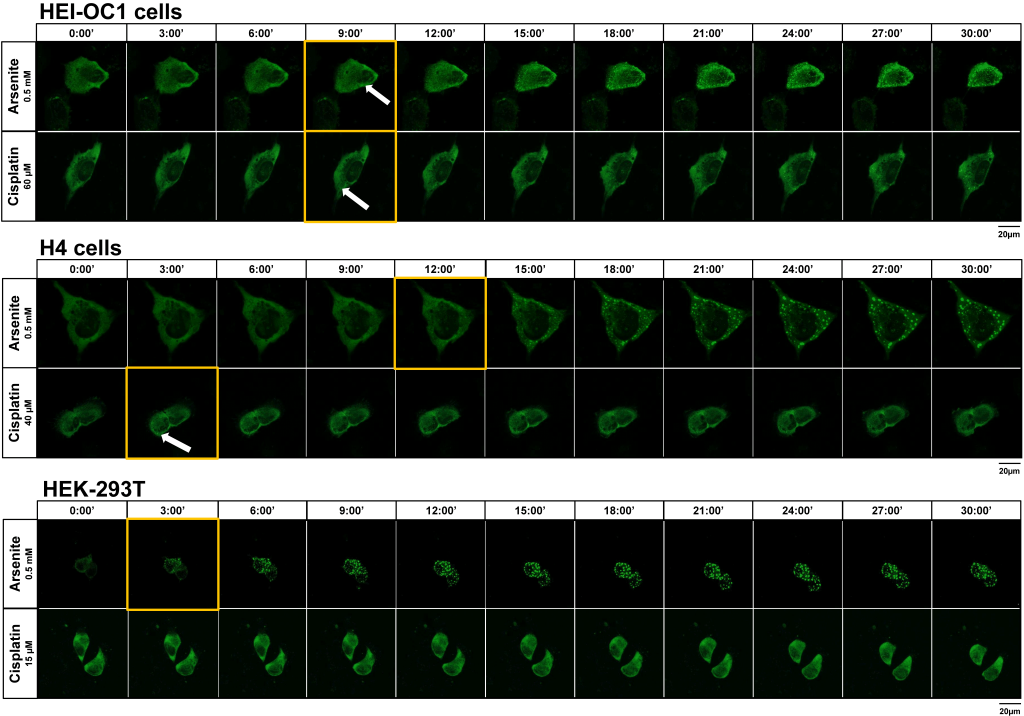
Live cell imaging experiments were able to illustrate the onset of SG formation in HEI-OC1 cells exposed to cisplatin after 9 minutes incubations. Similarly, incubation of HEI-OC1 with arsenite elicited SG assembly, also initiating at the 9-minute treatment (Fig. 4, Suppl. Material S1A,B). During the 30-minute observation period following gentamicin treatment, no discernible formation of SGs was observed (data not shown).
Cisplatin induces the formation of SGs in H4 human neuroglioma cells
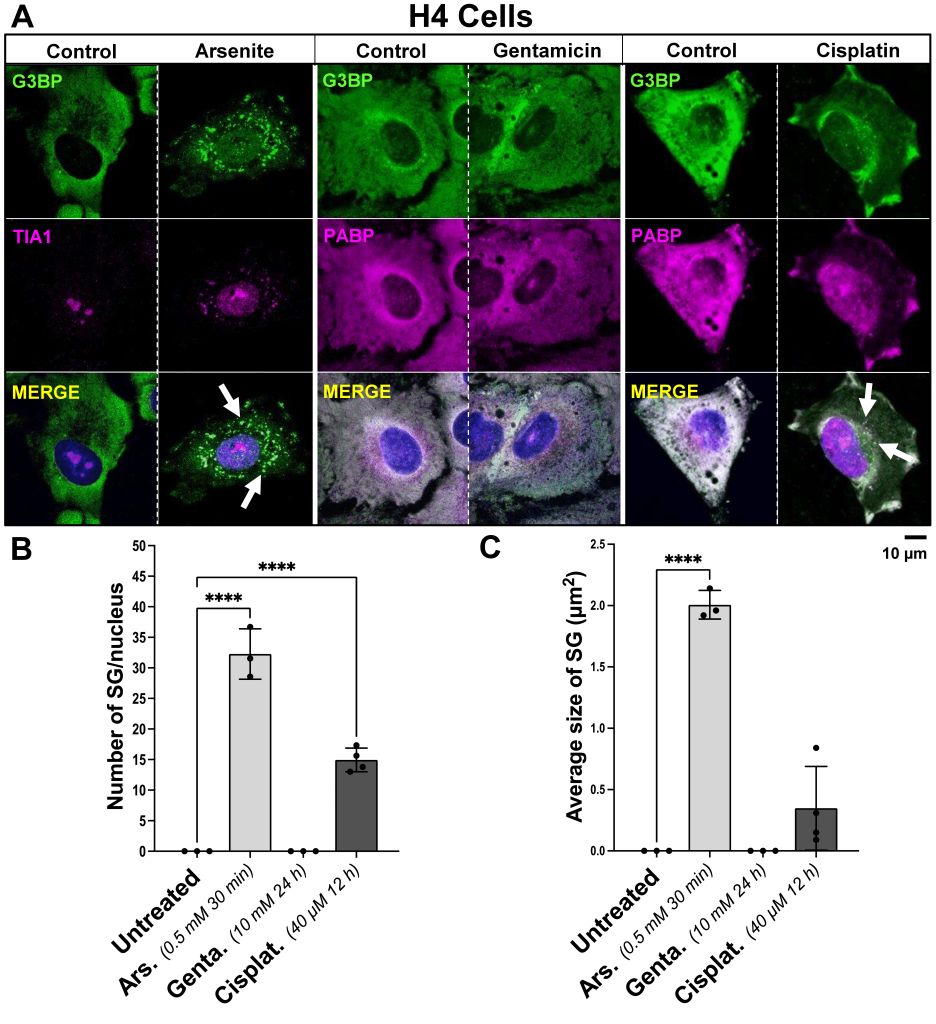
H4 cells were incubated with 40 µM cisplatin for 12 h or 10 mM gentamicin for 24 h, compared to vehicle control. As a positive control for SG formation, H4 cells were incubated with 0.5 mM arsenite for 30 min, and compared to vehicle control. Immunocytochemistry was performed targeting main SG protein markers G3BP, PABP or TIA1, showing cisplatin-induced SG formation (Fig. 2). No SGs were observed in control experiments (data not shown). Incubation of H4 cells with gentamicin did not trigger the formation of SGs (Fig. 2A). Cells incubated with cisplatin for 12 h displayed, on average, 14.94 ± 1.938 SG per cell, compared to vehicle-treated cells where no SGs were observed [p<0.0001]. Exposure to arsenite for 30 min was used as positive control for SG formation, with an average of 32.27 ± 4.118 SGs per cell, compared to vehicle-treated cells where no SGs were observed [p<0.0001] (Fig. 2B). The size of SGs formed after 12 h incubation with cisplatin was 0.348 µm2 ± 0.341 [p<0.05], while the size of SGs formed after 30 min of incubation with arsenite exhibited an average size of 2.007 µm2 ± 0.117 [p<0.0001] (Fig. 2C).
–
Live cell imaging experiments enabled the detection of SGs in H4 cells exposed to cisplatin after 3 minutes of incubation. Exposure to arsenite elicited SG assembly at 9-minute treatment (Fig. 4, Suppl. Material S1C,D). During the 30-minute observation period following gentamicin exposure, no discernible formation of SGs was observed (data not shown).
–
HEK-293T cells do not form SGs upon cisplatin or gentamicin treatment
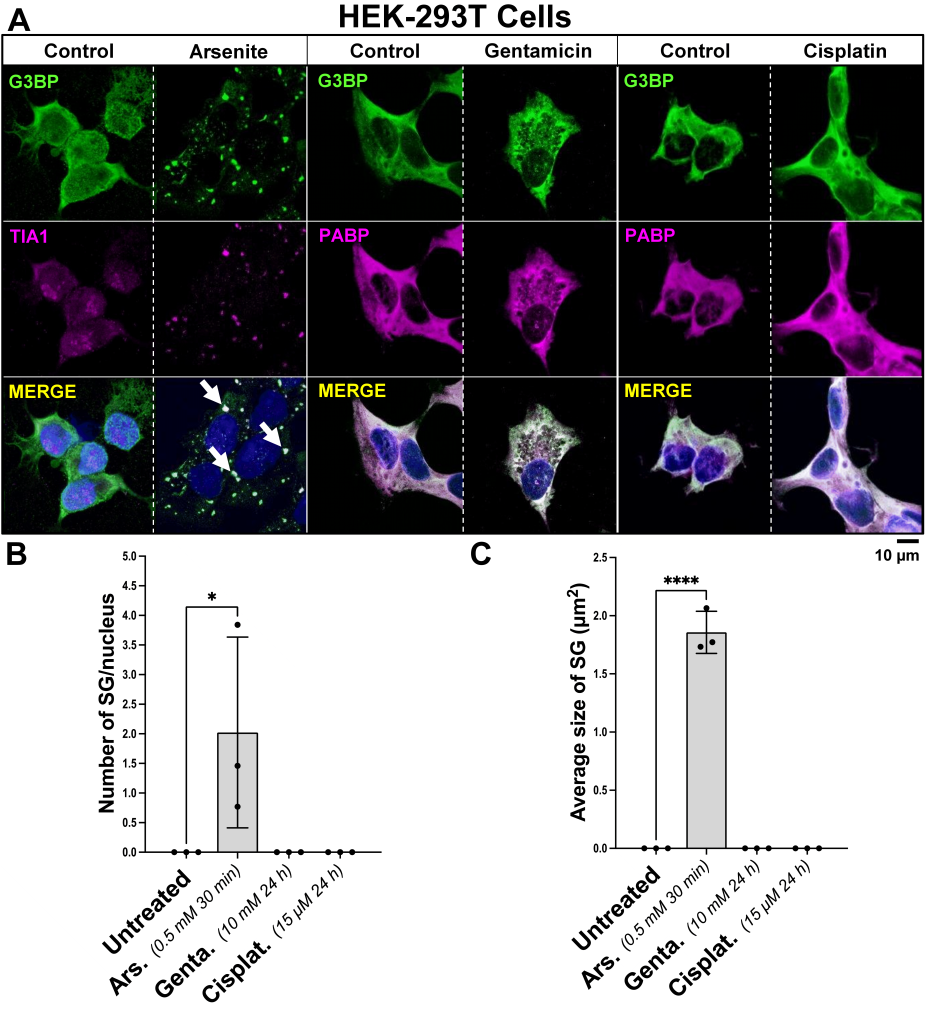
HEK-293T cells were incubated with 15 µM cisplatin or 10 mM gentamicin for 24 h, compared to vehicle control. As a positive control for SG formation, cells were incubated with 0.5 mM arsenite for 30 min, and compared to vehicle control. Immunocytochemistry was performed targeting main SG protein markers G3BP, PABP or TIA1. We found that treatment with either cisplatin or gentamicin did not elicit SG formation in these cells (Fig. 3A). On the other hand, treatment with arsenite induced SG formation already after 3 minutes of incubation, compared to vehicle-treated cells, where no SGs were observed [p<0.05] (Fig. 4). After 30 min, the number of SGs exhibited an average of 2.023 ± 1.611 SGs per cell, when compared to the control group [p<0.05], and a size of 1.857 µm2
± 0.181 [p<0.0001] (Fig. 3B,C).
–
Cisplatin and gentamicin do not induce changes inthe levels of SG-related proteins
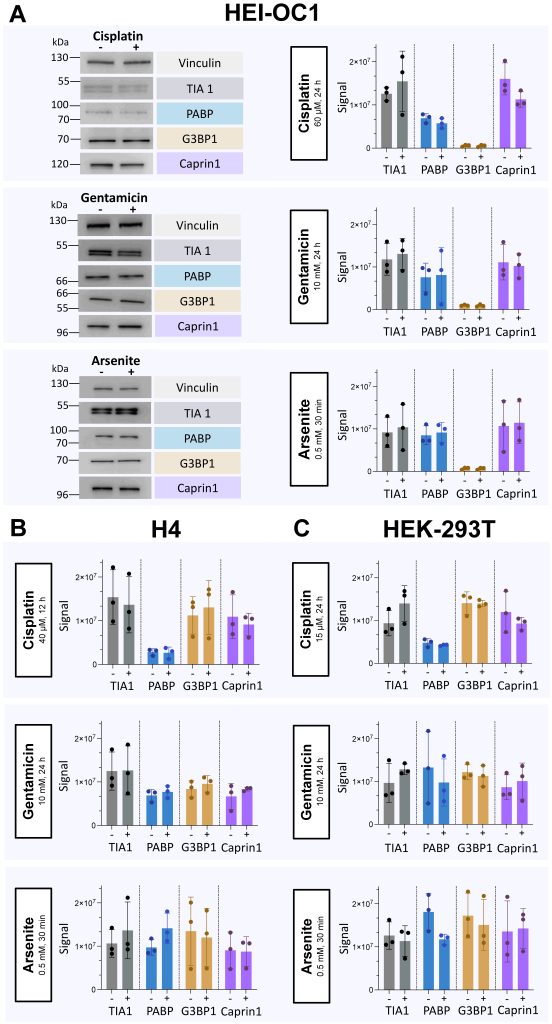
HEI-OC1, H4 and HEK-293T cell lines were subjected to SDS-PAGE after incubation with cisplatin for 12 or 24 h, gentamicin for 24 h, or arsenite for 30 min, compared to vehicle control. We analyzed key proteins implicated in the process of SG formation, including TIA1, PABP, G3BP1, and Caprin1, to assess expression changes after the specified treatment duration. Our results demonstrated stable protein levels of TIA1, PABP, G3BP1, and Caprin1 within HEI-OC1, H4, and HEK-293T cells following exposure to cisplatin or gentamicin in all our experiments. The exposure to arsenite for 30 min also did not change the levels of these proteins (Fig. 5).
–
RNA is present in cisplatin-induced SGs in H4 cells
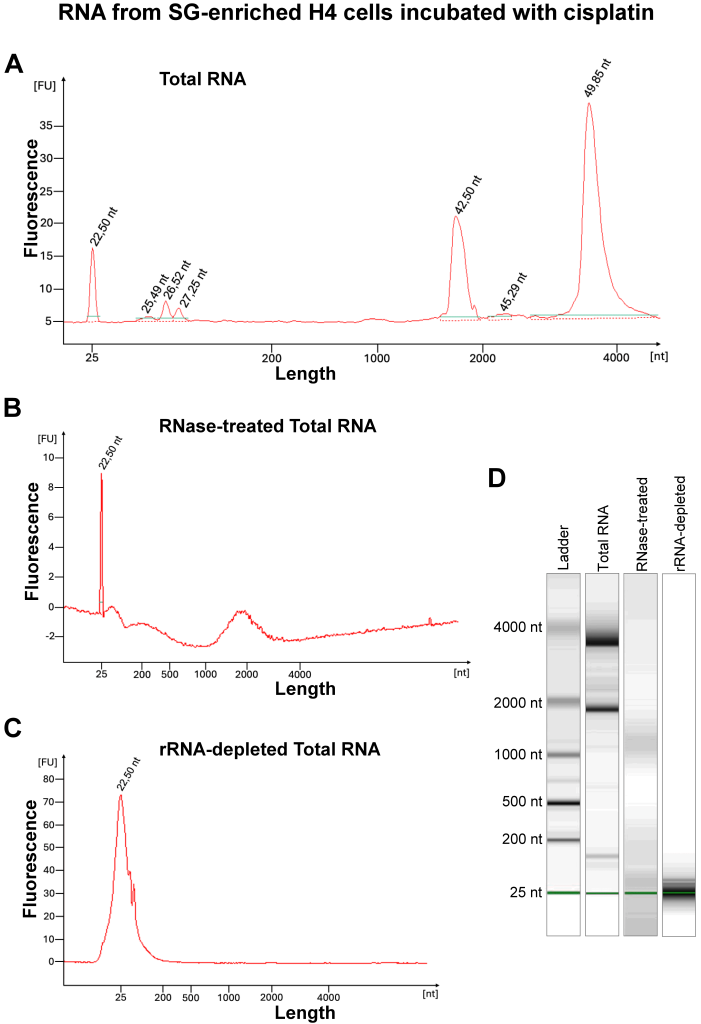
To assess the presence of RNA in SGs associated with cisplatin treatment, preparations from total H4 cell lysate, treated with 40 μM cisplatin for 12 h, were enriched for SG core by a series of centrifugation steps following the protocol, as previously described (Fig. 6). As a positive control, preparations from total cell lysates from H4 cells treated with 0.5 mM arsenite for 30 min were enriched for core; enrichment efficiency was evaluated using total protein and Western blotting analysis (Fig. 6B-D). We then assessed the presence of RNA in the purified SGs using Bioanalyzer and electropherogram representation of RNA separation from SG-enriched cisplatin-treated cells (Fig. 7). Our results confirmed the presence of RNA, as demonstrated by peaks at 26.52 nt and 27.25 nt, corresponding to 5S and 5.8S rRNA, as well as peaks at 42.50 nt and 49.85 nt length, corresponding to 18S and 28S rRNA (Fig. 7A,D). Total RNA preparations were treated with RNase to demonstrate the peaks were indeed RNA (Fig. 7B,D).
–
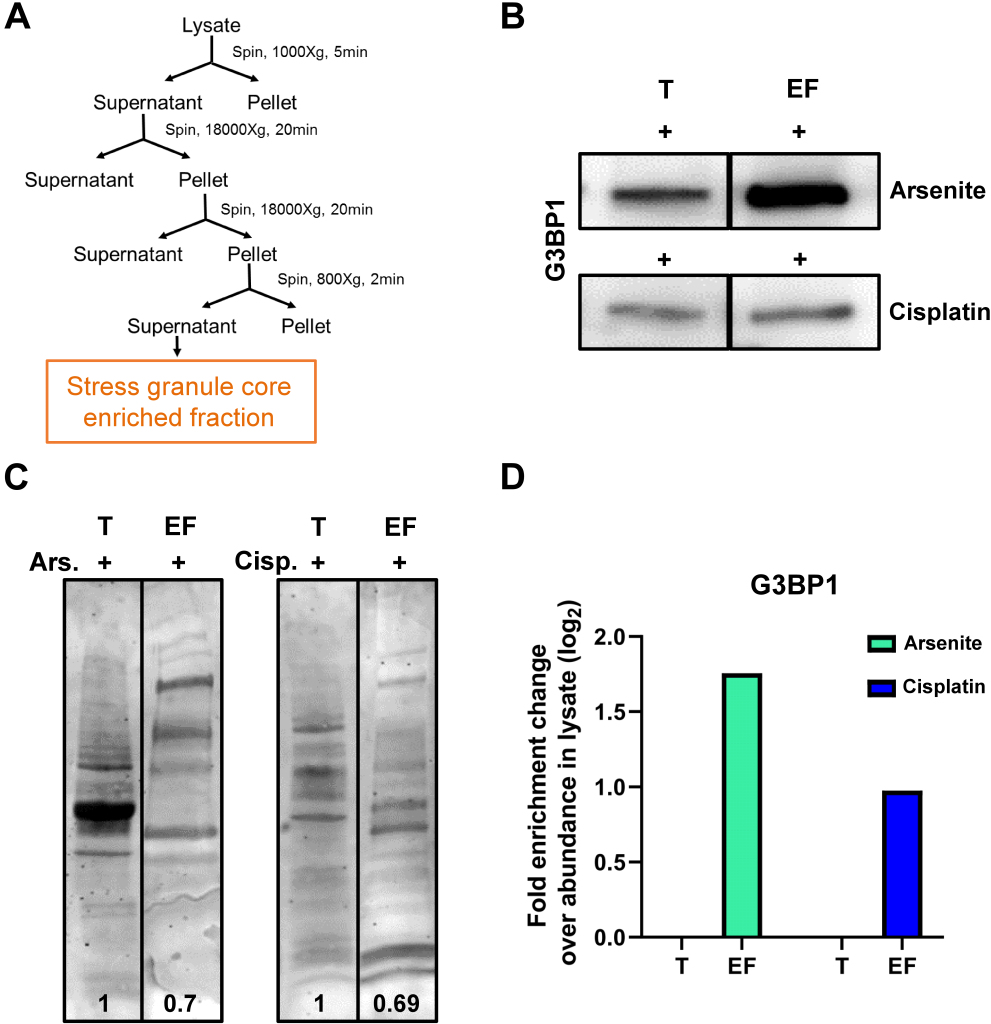 | FIGURE 6: Enrichment of SG cores from cells treated with cisplatin. (A) Schematic representation of the protocol for SG core enrichment adapted from Wheeler et al., 2017 [27] . (B) Western blot for G3BP1 in arsenite and cisplatin-treated H4 cell lysate (T) and their SG cores enriched fraction (EF). (C) Representative image of total protein amounts in T and EF from both arsenite and cisplatin-treated H4 cells. The relative amounts of total protein are shown at the bottom of each lane (D) Log2 plot of fold enrichment change in G3BP1 in EF relative to T. |
Cisplatin-assembled SGs in cells persist after stress alleviation
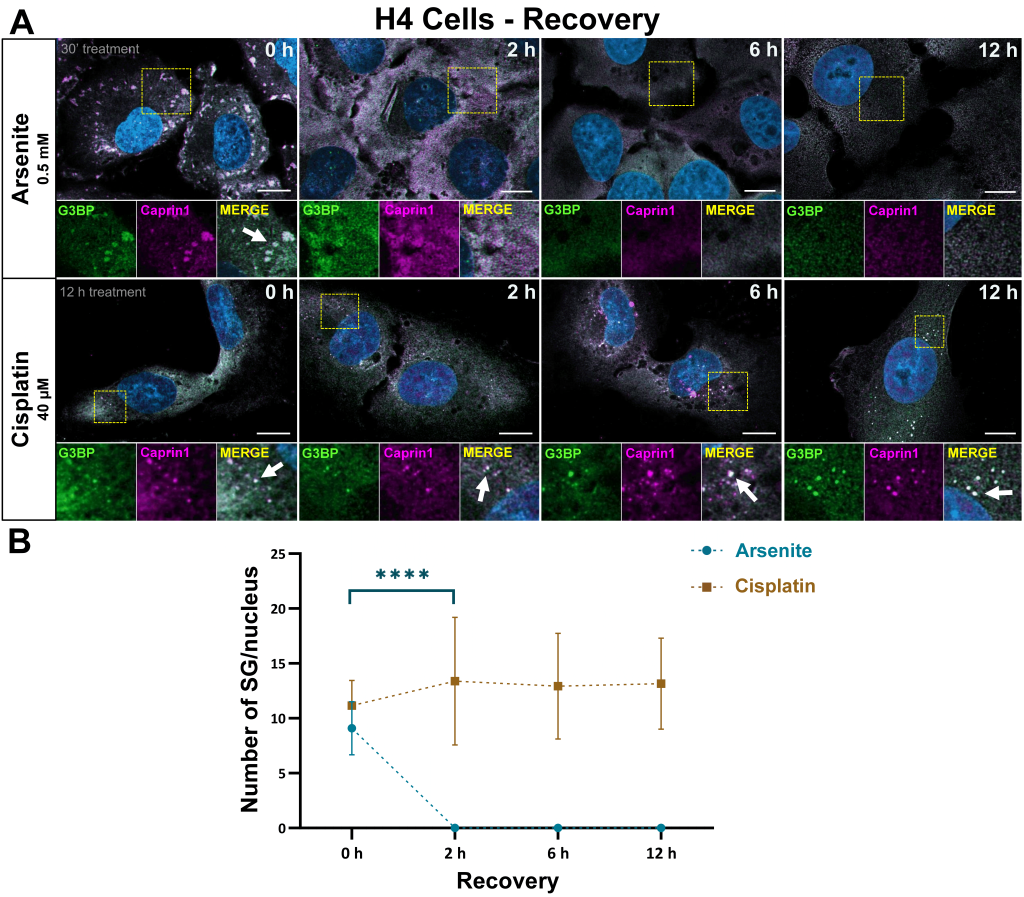
Next, we assessed the dynamics of SGs formed in H4 cells formed upon 12 h exposure to 40 µM cisplatin. H4 cells were used given their increased susceptibility to cisplatin-induced cytotoxicity. The concentration and timepoint of cisplatin incubation was set prior to the alleviation experiments, as described. To further confirm the composition of the SGs formed in these conditions, we used two established SG markers, G3BP and Caprin1, and assessed the presence of SGs at 2, 6, and 12 h post cisplatin removal (Fig. 8A). The ratio of cisplatin-associated SGs per cell remained constant throughout (Fig. 8A,B). Alleviation experiments after arsenite-induced SG formation (0.5 mM arsenite for 30 min) served as control, and these experiments were performed in parallel to the cisplatin experiments, targeting the same proteins at the same time points, showing a complete clearance of SGs at 2 h post drug removal (Fig. 8A,B).
–
 | FIGURE 7: Enrichment of SG cores from cells treated with cisplatin. (A) Schematic representation of the protocol for SG core enrichment adapted from Wheeler et al., 2017 [27] . (B) Western blot for G3BP1 in arsenite and cisplatin-treated H4 cell lysate (T) and their SG cores enriched fraction (EF). (C) Representative image of total protein amounts in T and EF from both arsenite and cisplatin-treated H4 cells. The relative amounts of total protein are shown at the bottom of each lane (D) Log2 plot of fold enrichment change in G3BP1 in EF relative to T. |
DISCUSSION
RNP granules are constitutive dynamic subcellular condensates within cells that are subject to numerous layers of potential regulation. SGs are not-constitutive RNP granules that form in the cytoplasm in response to disturbances in the homeostasis of the cellular microenvironment, playing an important role in the compartmentalization of RNPs in response to stress. Platinum-based chemotherapeutic agents, including cisplatin and carboplatin, are vastly employed antineoplastic drugs for treating a variety of malignancies. Included on the World Health Organization’s (WHO) list of essential medicines 28, their cytotoxic effects are widely acknowledged and impose dose limitations; consequently, they increase the risk of adverse reactions in many patients, with ototoxicity and neurotoxicity being the most prevalent 29. Cisplatin-induced ototoxicity is usually irreversible, with an incidence between 20%-70% 30, 31, 32, 33. In the inner ear and HEI-OC1 auditory cells, cisplatin cytotoxicity has been associated with the activation of proinflammatory cytokines 34 and ROS production 35, 36, subsequently promoting lipid peroxidation 37, 38, 39, protein nitration 40, and DNA damage 41. According to research findings, cisplatin toxicity directly affects the ER, resulting in ER stress that is distinct from oxidative stress 42.
–
In our experiments, we used arsenite as the positive control for SG formation in all three different cell lines. Based on the distinct stages of SG assembly associated with arsenite exposure as previously described 43, 30 min of incubation with arsenite was chosen as the standard to positively assess SG formation. In HEI-OC1 cells in particular, longer treatments with arsenite were associated with increased cytotoxicity, manifested as wide range of apoptosis and cellular detachment. For cisplatin and gentamicin treatments, the concentrations chosen for experiments was determined by assessing cell survival for a specific time. The concentration of the drugs was determined through pre-experimental evaluations, in which the drugs induced a 50% cell death rate in cultured cells, a parameter which was used as an indicator of cytotoxicity to establish the appropriate concentration. The incubation time with cisplatin in H4 cells differed from the standard 24 h incubation period and was set at 12 h for experimental analysis. This adjustment was made due to the significant decrease in cell survival observed beyond the 12 h, and may explain some differences observed between the cell lines used. Due to notable differences in SG size between arsenite-triggered versus cisplatin-triggered SGs, our observations in HEI-OC1 auditory cells and in H4 cells are in line with previous work suggesting that SGs differ in morphological composition 44. Previous work in inner ear-derived UB/OC2 cells 45 and U2OS osteosarcoma-derived cells 46 both showed that SGs triggered by cisplatin were significantly smaller in size compared to arsenite, consistent with our findings. In fact, cytoplasmic inclusions related to cisplatin exposure have a biomolecular composition that includes well-established canonical SG components, but is missing others, as e.g. the initiation factors IF3b and eIF4G 46. Our experiments revealed that SG markers G3BP and PABP were detected in cisplatin-induced SGs in both HEI-OC1 and H4 cells (Fig. 1,2). Furthermore, Caprin1 was also observed in H4 cells, persisting even during the alleviation experiments following the removal of cisplatin (Fig. 8). Therefore, our findings suggest that cisplatin-induced SGs display altered dynamics when compared to SGs formed in response to other stressors, consistent with previous findings employing cell lines of diverse origins 45, 46. Nevertheless, this raises the question of whether SGs linked to cisplatin exposure can be classified as bona fide SGs, given their reduced dynamics in the conditions tested.
Our findings indicate that drug treatment did not induce an increase in the expression of canonical SG-associated proteins despite the formation of SGs (Fig. 5). An alternative explanation to consider is that canonical RBPs that might be necessary for SG formation might be already present as relevant intracellular constituents across cell lines and, therefore, do not require upregulation for SG assembly. Several studies have implicated canonical RBPs as essential for SG assembly, including TIA1 47, and G3BP 48. PABP plays a critical role in regulating the abundance and stability of select mRNA populations in human cells 49. Caprin1 plays a crucial role in normal cell proliferation 50, and is involved in mediating LLPS during SG assembly 51, interacting with G3BP1, mRNAs, and noncoding RNAs, collectively contributing to the formation of SGs 52.
Our experiments did not demonstrate the activation of SG machinery in HEI-OC1 cells in relation to gentamicin-associated cytotoxicity. Aminoglycosides, characterized by a wide-ranging spectrum of antibiotic activity, are utilized in the treatment of numerous infections in all age groups of patients 53, and their ototoxic potential has been extensively documented 54. In mice, the formation of SGs has been previously reported in cochlear hair cells in organotypic cultures of cochlear explants exposed to the aminoglycoside antibiotic neomycin, as well as following kanamycin administration in vivo
55. The HEI-OC1 cell line has proven to be highly useful as a model for studying the biological responses related to auditory sensory cells and supporting cells. Nevertheless, it is important to acknowledge that subcellular responses may be unique to different cell lines 56. Upon exposure to gentamicin, HEI-OC1 cells exhibited the occurrence of cell membrane blebs (Fig. 1), characterized as spherical protrusions of the plasma membrane 57. We attribute the formation of these blebs to the execution phase of apoptosis, as formerly reported 58.
Our experiments confirmed the presence of RNA in SGs induced by cisplatin (Fig. 7). However, future analyses will be required to determine the exact nature of the RNAs present. Previous studies have demonstrated that the presence of mRNA depends on the cell type 45. Given the several side effects associated with cisplatin cytotoxicity, it is imperative to develop interventions that can mitigate its cytotoxicity without compromising its antineoplastic efficacy. Efforts to alleviate the long-term cellular damage associated with systemic administration of platinum-based chemotherapeutic agents should focus on developing compounds that can reduce these drugs’ side effects 59, 60, 61. To protect the inner ear from ototoxic damage and considering the broad age spectrum of patients requiring platinum-based chemotherapy, a local transtympanic drug administration could be a plausible strategy 62, 63, 64. Therefore, understanding the mechanisms associated with the formation of SGs, as well as the specific molecules recruited in relation with cisplatin exposure remains crucial.
The presence of established SG markers (G3BP, PABP, and Caprin1) in the cisplatin-induced inclusions in H4 cells, suggests the inclusions are SGs. However, the persistence of cisplatin-associated SGs after exposure cessation indicates that there may be differences in the assembly/disassembly process that may be responsible for the cellular damage associated with this chemotherapeutic agent. This particular aspect will need to be further explored in future studies, as it may open novel perspectives in efforts to mitigate the cytotoxic side effects linked to the systemic administration of cisplatin.
MATERIALS AND METHODS
Cell lines
Three cell lines were utilized in our study: the HEI-OC1 auditory cell line, the H4 human neuroglioma cell line (HTB-148; ATCC), and the human embryonic kidney cell line HEK-293T. The HEI-OC1 cells, derived from the cochlea of the ImmortomouseTM 65, were cultured in Dulbecco’s modified Eagle’s medium (DMEM; Thermo Fisher Scientific, Waltham, MA, USA) supplemented with L-alanyl-L-glutamine, 10% fetal bovine serum (FBS) and 0.3% penicillin at 33°C with 10% CO2. The H4 human neuroglioma cells were cultured in Opti-MEM (Thermo Fisher Scientific) supplemented with L-alanyl-L-glutamine, 10% FBS and 1% penicillin-streptomycin at 37°C with 5% CO2. Meanwhile, the human embryonic kidney cells HEK-293T were maintained in DMEM supplemented with 10% FBS and 1% penicillin-streptomycin at 37°C with 5% CO2.
Drug treatments
Cells were plated onto 15-mm glass coverslips coated with 0.5% gelatin in 12-well plates at least 12 h before treatment initiation. 40,000 HEI-OC1 cells/well, 80,000 H4 cells/well, and 120,000 HEK-293T cells/well were seeded for experiments. HEI-OC1, H4 and HEK-293T cells were incubated with gentamicin (MilliporeSigma, Burlington, MA, USA) or cisplatin (MilliporeSigma) at various concentrations. Cisplatin and gentamicin were diluted in DMSO, which served as vehicle. Arsenite was diluted in deionized H2O. The specific drug concentration chosen for experiments was stablished according to the concentration that induced 50% of cell death after 24 h of drug exposure, compared to vehicle control. This issue was addressed visually under light microscopy. Incubation with 0.5 mM sodium arsenite (MilliporeSigma) for 30 min served as positive control for SG formation. With gentamicin, the concentration chosen for experiments was 10 mM. For treatment with cisplatin, HEI-OC1 cells were incubated with 60 µM cisplatin for 24 h, and HEK-293T cells with 15 µM cisplatin for 24 h. An exception arose with H4 cells incubated with cisplatin, as no cells survived after a 24 h incubation time at any concentration. Consequently, the chosen cisplatin concentration was adjusted to an exposure time of 12 h, i.e., a concentration that induced 50% of cell death after 12 h of drug exposure, and compared to vehicle control. H4 cells were hence incubated with 40 µM cisplatin for 12 h, and compared to vehicle control. After treatment, cells were washed with PBS, fixed with 4% paraformaldehyde for 20 min at room temperature, and prepared for immunocytochemistry.
Immunocytochemistry
Cells were permeabilized with PBS containing 0.1% Triton X100 for 20 min and blocked with 1.5% normal goat serum for 1 h at room temperature, followed by incubation with a combination of two of these primary antibodies in the same blocking solution at a concentration of 1:1000 overnight at 4°C: mouse anti-G3BP (#ab56574, Abcam), rabbit anti-TIA1 (#SAB4301803, MilliporeSigma), rabbit anti-PABP (#ab21060, Abcam), rabbit anti-Caprin1 (#15112-1-AP, Proteintech). The following day, cells were incubated with blocking solution containing Alexa Fluor anti-rabbit 488 and Abberior anti-mouse 635P secondary antibodies at a concentration of 1:1000 for 2 h at room temperature. Shortly before mounting, a DAPI staining was performed for 15 min at room temperature. Coverslips were mounted on glass slides.
Confocal microscopy
Confocal images were acquired on an Abberior Expert Line STED microscope (Abberior, Göttingen, Germany) based on an Olympus IX83 inverted microscope using a 1.4 UPlanSApo 100x oil immersion objective. The excitation lasers used were 488 nm and 640 nm. Image stacks were acquired using the Imspector Software 16.3 (Abberior) with a 15 µs dwell time and a pinhole set at 1.1, xy pixel sizes of 80 x 80 nm and z-stack steps of 100-200 nm.
Live cell imaging
Cells were seeded at least 12 h previous to the experiments. 40,000 HEI-OC1, 80,000 H4, and 120,000 HEK-293T cells were plated in individual glass-bottom 35 mm µ-Dishes (Ibidi, Gräfelfing, Germany). The transfection was performed using the G3BP1-GFP plasmid utilizing Metafectene (Biotex, Munich, Germany) in a 1:2 ratio for HEI-OC1 and HEK-293T cells, and a 1:3 ratio for H4 cells, and according to manufacturer’s instructions 8 h for HEI-OC1 cells, and 24 h for HEK-293T and H4 cells. The culture medium was changed shortly previous treatment initiation. The plate was then transferred to the temperature- and CO2-controlled chamber at the microscope setup, where treatment drugs were administered at the pre-determined concentrations, corresponding to timepoint 0 in the live cell imaging process. The live cell imaging was performed using a Zeiss LSM 800 with Airyscan confocal point-scanning microscope (Carl Zeiss, Jena, Germany) with a 1.4 UPlanSApo 100x oil objective. Z-stack images with 15 slices per image were captured at 3-minute intervals. Timepoint 0 was established when the treatment was administered, which lasted for a minimum of 30 min. At least three points on each plate were selected to monitor the progression of the effects of each treatment for every cell line. Confocal live cell images were captured under optimal conditions, settings were adjusted using the ZEN Software (Carl Zeiss).
Western blotting
Protein levels of TIA1, PABP, G3BP1 and Caprin1 were assessed by western blotting. After incubation, cells were lysed in protein extraction reagent lysis buffer (T-PER; Thermo Fisher Scientific) containing protease and phosphatase inhibitors (Roche, Basel, Switzerland). Protein concentration was estimated using the Bradford method. Cell lysates were denaturized in 4x Laemmli’s sample buffer at 95°C for 5 min. 20 µg of protein were loaded and separated by SDS-PAGE. Gels were them immersed in 20% ethanol for 10 min, and proteins were transferred to polyvinylidene difluoride (PVDF) membranes using the iBlot 2 Dry Blotting System (Thermo Fisher Scientific) for 7 min at 25 V, 0.9 A. PVDF membranes were subsequently placed in blocking solution containing 5% bovine serum albumin (BSA) in TBS-Tween 0.05% for 1 h at room temperature. Membranes were incubated overnight at 4°C in blocking solution containing the first antibody. The following primary antibodies were used: rabbit anti-G3BP1 1:6000 (#13057-2-AP, Proteintech), rabbit anti-TIA1 1:2000 (#12133-2-AP, Proteintech), rabbit anti-PABP 1:2000 (#ab21060, Abcam), rabbit anti-Caprin1 1:6000 (#15112-1-AP, Proteintech). Incubation of the same membranes with mouse anti-Vinculin 1:6000 (#sc-55465, Santa Cruz) served as a loading control. On the next day, membranes were washed in TBS-Tween 0.05% and incubated for 1 h at room temperature in blocking solution containing HRP-conjugated secondary antibodies 1:10,000. Chemiluminescent signals were characterized utilizing Fusion Fx Spectra 7.0 (Vilber, Marne-la-Vallée, France). Band intensity analysis was performed utilizing the Fiji open-source software 2.9.0.
Statistical analyses
SGs were quantified per number and/or size/area within cells using the channel corresponding to the G3BP staining, and analyzed semi-automatically using the Analyze Particle plugin from the Fiji open-source software 2.9.0. As SGs varied in size depending on drug exposure, SGs were counted by defining a specific size range specific to each drug. The pixel size (pixel^2) was set in a range between 0.10 – 10.0 for cells treated with cisplatin, and in a range between 0.70 – 10.0 for cells treated with arsenite or gentamicin. The statistical significance of the cell death, the formation of SGs per cell, and the average number of SG per cell ± SD for all three drugs in cells exposed to treatment versus untreated cells was carried out using one-way ANOVA with Tukey’s multiple comparison test. The adjusted p-value represented * = p < 0.05, ** = p < 0.01, *** = p < 0.001, **** = p < 0.0001.
SG core enrichment
H4 human neuroglioma cells were cultured to obtain a 90% confluence. Cells were treated with 40 μM cisplatin (MilliporeSigma) versus DMSO for 12 h or with 0.5 mM arsenite (MilliporeSigma) for 30 min versus H2O. following which the cells were scraped, collected and centrifuged. The SG enrichment protocol was performed as described by Wheeler et al., 2017 27 . The cells were pelleted at 1500 g for 3 min at room temperature. The cell pellets were snap frozen and syringe lysis was performed using a 25G needle on ice in SG lysis buffer supplemented with ribonucleases inhibitors (Promega, Madison, WI, USA), as well as proteases inhibitors (Roche), containing 50 mM Tris HCl pH 7.4, 100 mM Potassium acetate, 2 mM Magnesium acetate, 0.5 mM DTT, 50 μg/ml Heparin, 0.5% NP40 and 1:5000 Antifoam B. Following lysis, the cell debris was pelleted at 1000 g for 5 min at 4°C. The supernatant was then used for a series of centrifugation steps as per the protocol to finally achieve a SGs-enriched pellet. The final pellet was resuspended in 60 μl SGs lysis buffer and centrifuged at 850 g for 2 min at 4°C followed by collection of the supernatant as the SG-enriched fraction.
Total protein detection and immunoblotting of SG core enriched fraction
Protein levels of G3BP1 in both total crude cell lysate (T) and SG core enriched fraction (EF) were estimated by western blotting. Protein concentrations were quantified using a Pierce BCA Protein Assay Kit and 10 µg of protein were loaded onto a 4-20% precast SDS-PAGE gel. Proteins were transferred to polyvinylidene difluoride (PVDF) membrane using the iBlot 2 Dry Blotting System (Thermo Fisher Scientific) for 7 min at 25 V, 0.9 A. Immediately after transfer, the membrane was stained in RevertTM Total Protein stain solution (Li-Cor, Bad Homburg, Germany) for 5 min at room temperature. Image for fluorescent immunodetection were acquired using Odyssey CLx (Li-Cor) according to the manufacturer’s instructions. After washing with ultrapure H2O, the membrane was subsequently placed in blocking solution containing 5% BSA in TBS-Tween 0.05% for 1h at RT followed by overnight primary antibody (rabbit anti-G3BP1 1:6000, #13057-2-AP, Proteintech) incubation at 4°C. On the next day, membrane was washed in TBS-Tween 0.05% and incubated for 1h at room temperature in blocking solution containing an HRP-conjugated anti-rabbit secondary antibody 1:10,000. Chemiluminescent signals were characterized utilizing Fusion Fx Spectra 7.0 (Vilber). Total protein and bands intensity analysis, as well as the normalization of G3BP1 signal to the Total Protein signal in both T and EF, were performed manually utilizing the Fiji open-source software v2.14. The plot showing fold enrichment change in G3BP1 in EF relative to T was performed utilizing Graphpad Prism 8.4.3 software (Graphpad Software, Boston, MA, USA).
Total RNA isolation fromSG-enriched fractions
RNA isolation was performed using TRIzol™ Reagent (#15596026, Thermo Fisher Scientific) following the manufacturer’s protocol. Briefly, equal volume of TRIzol™ (60 μl) was added to SGs-enriched factions. The samples were incubated at room temperature for 5 min. 12 μl of chloroform was then added, and the samples were shaken and rested for 2-3 min at room temperature. The samples were then centrifuged at 14 000 g for 15 min at 4°C. The top clear phase containing RNA was carefully separated into a fresh microcentrifuge tube. RNA clean-up was performed by adding an equal volume of 100% ethanol and further using the RNA Clean and Concentrator 5™ Kit (#R1014, Zymo Research, Irvine, CA, USA) following manufacturer’s protocol. RNA was finally eluted in 6µl DNase and RNase free water. This total RNA sample was then used for RNase degradation and rRNA depletion.
RNA degradation using RNase treatment
RNase degradation was performed by adding RNase A™ DNase and protease-free (#EN0531, Thermo Fisher Scientific) to the RNA sample and incubating at 37°C for 2 h. The degraded RNA was cleaned using the RNA Clean and Concentrator 5™ Kit (Zymo Research). Briefly, twice the amount of RNA binding buffer was added to the RNA sample, which was then thoroughly mixed before adding twice the amount of 100% ethanol. The clean-up was performed as per the manufacturer’s instructions.
Ribosomal RNA (rRNA) depletion from total RNA samples
Depletion of rRNA was performed utilizing the NEBNext™ rRNA Depletion Kit (#E7400L, New England Biolabs, Ipswich, MA, USA). The protocol was performed as per the manufacturer’s instructions. NEBNext™ RNAClean sample purification beads (New England Biolabs) were utilized to bind the remaining RNA. Finally, the RNA was eluted in 7 µl of DNase and RNase free water and then, 5 µl was collected for analysis.
Bioanalyzer RNA analysis
All the RNA samples including total RNA, degraded RNA and rRNA-depleted RNA were checked for their quality using Agilent 2100 Bioanalyzer™ (Agilent Technologies, Santa Clara, CA, USA). Total RNA was assessed using the Agilent eukaryotic RNA Nano Kit (#5067-1511, Agilent Technologies) according to manufacturer’s instructions. Degraded RNA and rRNA-depleted samples were checked using the Agilent eukaryotic RNA Pico Kit (# 5067-1513, Agilent Technologies) as being more sensitive to lower RNA concentrations. The experiment was performed as per the manufacturer’s protocol. Electropherograms for each sample were obtained after each run.
Data availability
The authors state that all data necessary for confirming the conclusions presented in the manuscript are represented fully within the manuscript.
SUPPLEMENTAL INFORMATION
![]() Download Supplemental Information
Download Supplemental Information
ACKNOWLEDGMENTS
The authors wish to extend their gratitude to Dr. Kristin Baer and The European Neuroscience Institute Göttingen (ENI-G) for the collaboration and support in facilitating live cell imaging experiments, as well as to Professor Dr. F. Kalinec from The House Institute Foundation at UCLA for generously supplying the HEI-OC1 cell line for our experiments. The authors also wish to extend their sincere appreciation to the International Max Planck Research School (IMPRS) for providing an exceptional scientific framework.
COPYRIGHT
© 2024

Stress granules formation in HEI-OC1 auditory cells and in H4 human neuroglioma cells secondary to cisplatin exposure by Abdelrasol, Chopra et al. is licensed under a Creative Commons Attribution 4.0 International License.

