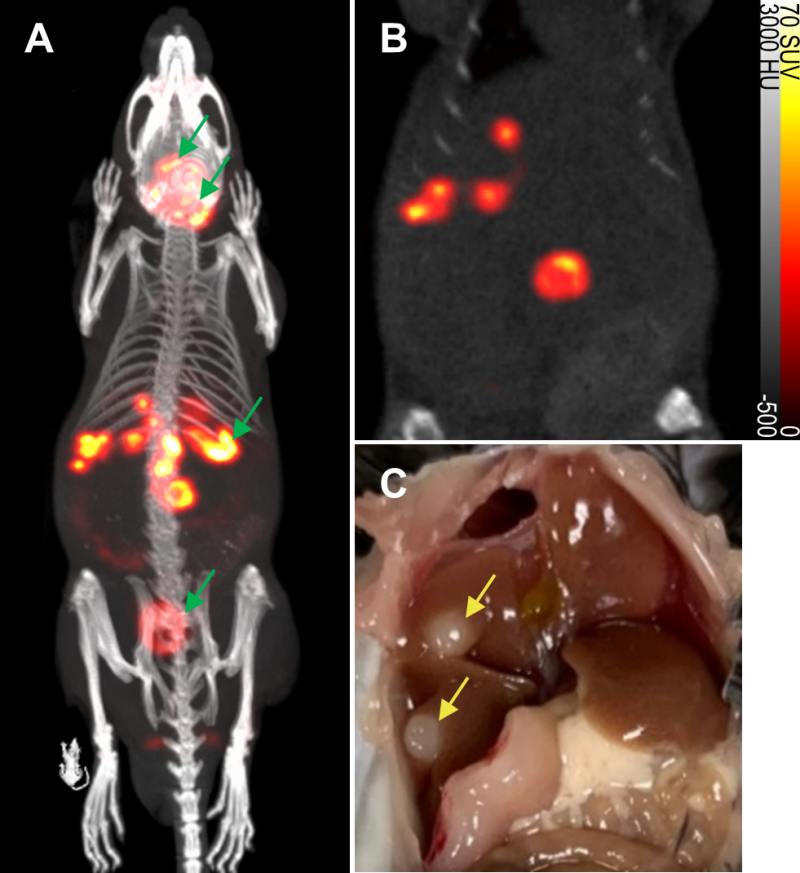
FIGURE 3: Detection of metastatic lesions in vivo by mNIS-SPECT. (A and B) A representative SPECT/CT maximum intensity projection (MIP) and a 2D coronal slice image of metastatic mNIS+/GH- pancreatic tumors developing predominantly in the liver, 5 weeks after tumor cell introduction via the portal vein. Note that the thyroid and salivary glands, stomach and bladder (denoted by green arrows in A) are sites of endogenous NIS expression or probe excretion and do not represent sites of tumor development. (C) Photograph of tumors (yellow arrows) in the liver of the same mouse imaged in A and B, taken 5 days later at necropsy (also see Figures S2 and S3).