Back to article: CRISPR-activation screen identified potassium channels for protection against mycotoxins through cell cycle progression and mitochondrial function
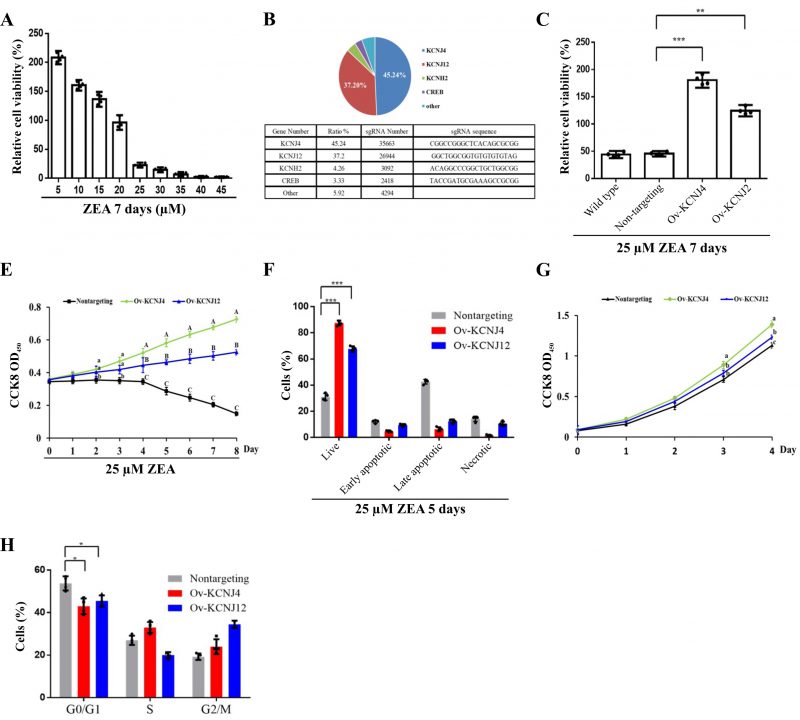
FIGURE 1: CRISPR-Cas9 screening generated two ZEA resistant intestinal cell lines. (A) The viability of HCT-8 cells was assessed following treatment with varying concentrations of ZEA for seven days. (B) Top four genes in the CRISPR-Cas9-based screen following treatment with 25 µM ZEA. (C) Cellular viability was determined for wild type, non-targeting-sgRNA-transduced cells, overexpression of KCNJ4 and KCNJ12 for seven days. (D) The three cell lines with the indicated tags were counted daily to assess their survival after treatment with 25 µM ZEA. (E) Percentages of necrosis, survival, and apoptosis were measured by PI/AnnexinV staining and flow cytometry. (F) The three cell lines were counted daily to assess their proliferation ability. (G) Cell cycle progression of the three cell lines was assessed. Data of figure D and figure F are expressed as means ± SEM. (n = 4/group). A two-way ANOVA with Bonferroni posttest was used for Figures D and F. A, B, C Values within a row with different superscripts differ significantly (P < 0.05); A, B, C Values within a row with different superscripts differ significant (P < 0.01). Other Data are presented as the mean ± SEM (n=4). p < 0.05 (*), p < 0.01 (**) and p < 0.001 (***), calculated by Student t-test.

