Back to article: Inflammation induced PD-L1-specific T cells
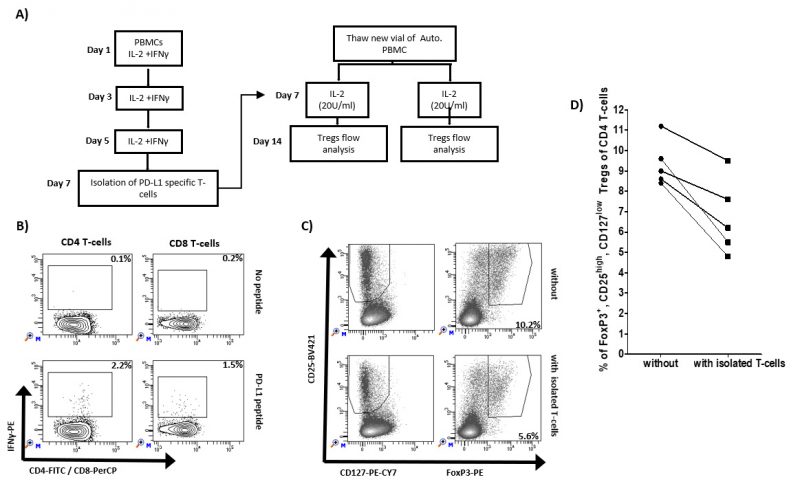
FIGURE 2: Impact of IFN-γ-induced PD-L1-specific T cells on regulatory T cells. (A) Experimental set up: PBMCs from five healthy donors were stimulated three times with IL-2 and IFN-γ. On day 7, PD-L1 specific T cells were isolated using IFN-γ secretion and capture assay. The isolated cells were added to freshly thawed autologous PBMCs. On day 14, frequency of Tregs in cultures with or without addition of isolated T cells were analyzed using flow cytometry analysis. (B) Example of flow analysis of PD-L1 specific CD4 and CD8 T cells isolation on day 7. (C) Example of gating strategy of FoxP3+, CD25high, CD127low Tregs of CD4 T cells. (D) Percentage of FoxP3+, CD25high, CD127low Tregs of CD4 T-cells from five different healthy donors without and with addition of isolated PD-L1 specific T cells.