Back to article: MiR-200c reprograms fibroblasts to recapitulate the phenotype of CAFs in breast cancer progression
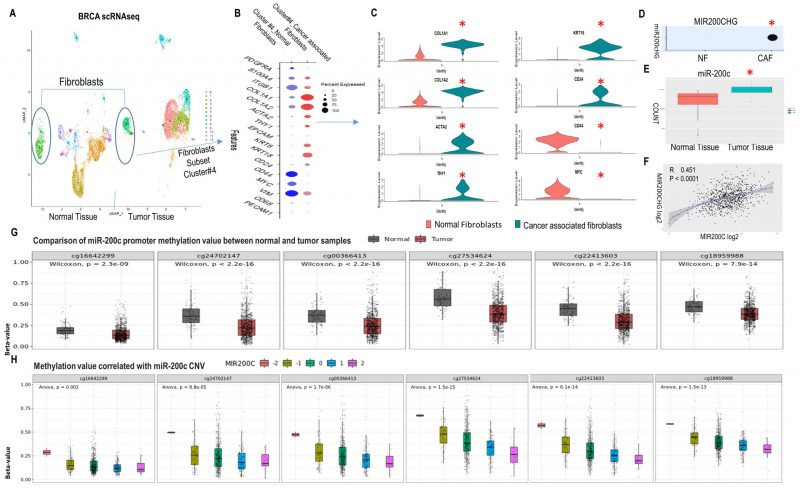
FIGURE 1: MET profile of CAFs in human breast cancer linked high miR200c expression to hypomethylation of the miR-200c promoter. (A) UMAP visualization of assigning normal fibroblast and CAF identity to cluster 4 and 5 in normal breast tissue (NT) and breast cancer tumor tissue (TT) by scRNAseq. Circled clusters are fibroblasts. All cell type profiles are listed in SFig. 1A. (B) Expression of markers in fibroblast cluster 4 from NT and TT by DotPlot. (C) VinPlot of expression of collagen, activated fibroblast, EMP and stemness markers in cluster 4 from NT and TT. *Seurat adjusted p < 0.05. (D) MIR200CHG level in cluster 4 from NT and TT. (E)Level of miR-200c in NT and TT from the TCGA breast cancer miRNAseq dataset. (F) Correlation between MIR200CHG and miR-200c from the TCGA breast cancer dataset. (G) Methylation status of miR-200c promoter region. Six sites are hypo-methylated in the tumor versus normal group. (H)Plot of the correlation between miR200c CNV and promoter methylation revealing a negative correlation. (A-D) are based on publicly available scRNA-seq data sets (GEO accession code GSE161529: GSM4909254 and GSM4909296). Data analysis was done in R using the Seurat package v4.3 with default parameters, padj<0.05.

