Back to article: Assay for high-throughput screening of inhibitors of the ASC-PYD inflammasome core filament
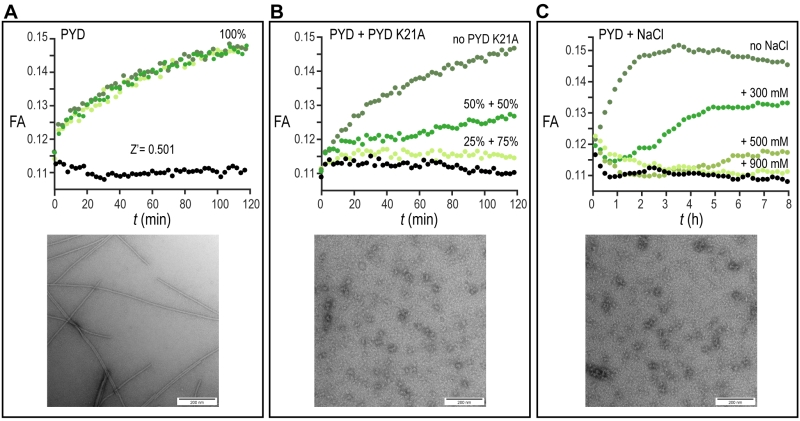
FIGURE 2: Proof of concept of the high-throughput fluorescence anisotropy assay. (A-C) The formation of the PYD filaments is monitored for three different conditions by the pH-based fluorescence anisotropy assay and negative-stained electron microscopy. (A) (Upper) Time-dependent fluorescence anisotropy (FA) measurements are reported for three independent experiments (shades of green) and for monomeric PYD without pH jump (black). Data points are recorded in 3 min intervals for a total time of 120 min. (Lower) EM image of negatively stained preparation of PYD filament after time-dependent fluorescence anisotropy measurement. (Scale bars, 200 nm). (B) (Upper) Time-dependent fluorescence anisotropy (FA) measurements for solutions of 100% PYD after pH jump (dark green), 50% PYD and 50% PYD K21A after pH jump (green), 25% PYD and 75% PYD K21A after pH jump (light green) and for monomeric PYD without pH jump (black). Data points are recorded in 3 min intervals for a total time of 120 min. (Lower) EM images of negatively stained preparation of 100% PYD K21A solution after incubation as in A. (Scale bars, 200 nm). (C) (Upper) Time-dependent fluorescence anisotropy (FA) measurements for solutions of PYD after pH jump (dark green), PYD with 300 mM NaCl after pH jump (green), PYD with 500 mM NaCl after pH jump (pale green), PYD with 900 mM NaCl after pH jump (light green) and for monomeric PYD without pH jump (black). Data are reported in 12 min intervals for a total time of 8 h. (Lower) EM image of negatively stained preparation of PYD solution with 900 mM NaCl after time-dependent fluorescence anisotropy measurement. (Scale bars, 200 nm).

