Back to article: mIDH-associated DNA hypermethylation in acute myeloid leukemia reflects differentiation blockage rather than inhibition of TET-mediated demethylation
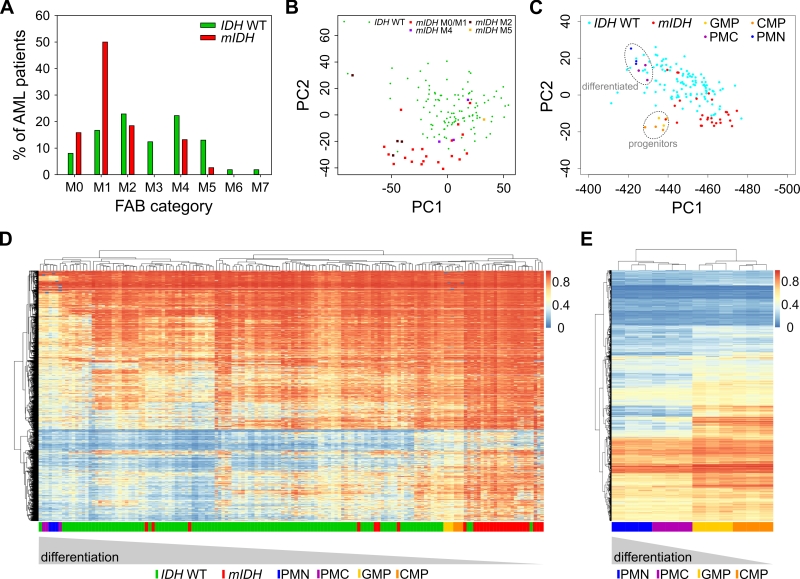
FIGURE 6: mIDH-associated hypermethylation reflects enriched hypermethylated hematopoietic progenitor populations rather than a pathological hypermethylator phenotype. (A) Analysis of the distribution of the French–American–British (FAB) categories assigned in the AML dataset from TCGA within the IDH WT and mIDH patient groups. (B) PCA as in Fig. 1A. Different FAB categories in the mIDH patient group are colored as indicated. Variances captured by PC1 and PC2 were 17.3% and 8.3%, respectively. (C) PCA with 450K profiles from sorted human cells of four hematopoietic differentiation stages [38]. TCGA AML patient profiles of mIDH/IDH WT patients were projected on top of the clusters generated by analysis of the four cell types. CMP: common myeloid progenitor, GMP: granulocyte macrophage progenitor, PMC: promyelocyte, PMN: polymorphonuclear/terminally differentiated bone marrow neutrophil. (D) Heatmap of the 10,000 most differentially methylated probes between the CMP/GMP and PMC/PMN populations in the AML cohort of mIDH/IDH WT patients. Each row shows one probe and each column one patient. A hierarchical cluster dendrogram showing similarities between samples is depicted on the top. The color scale indicates beta values. (E) Heatmap and hierarchical cluster dendrogram of human hematopoietic cell types using the 10,000 most differentially methylated probes between mIDH and IDH WT AML patients. Each row shows one probe and each column one sample. The color scale indicates beta values.

