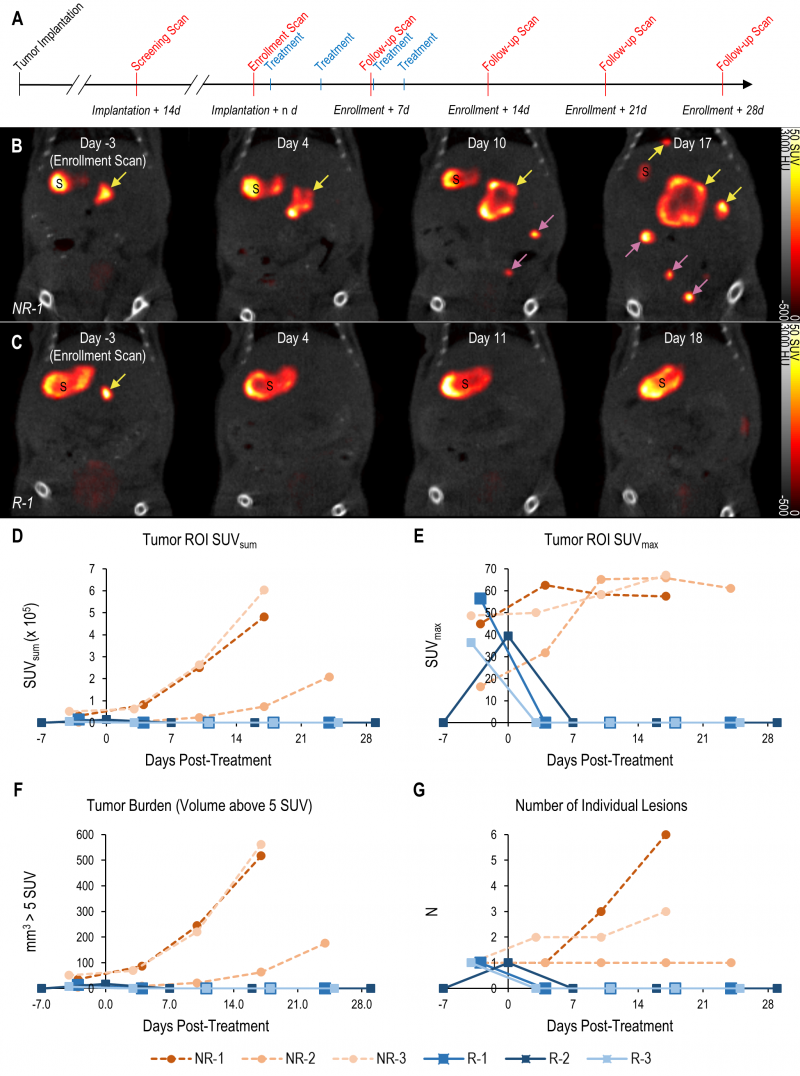
FIGURE 4: Treatment response monitoring of metastatic PDAC tumors using mNIS based SPECT/CT. (A and B) (A) Schematic experimental schedule for tumor implantation, imaging and drug treatment. (B) Coronal SPECT/CT images of representative mice from both experimental groups following implantation with wild-type or (C) KRT19 knockout tumor cells at: study enrollment (leftmost panels, day 15 post-implantation for NR-1 and day 14 for R-1); and following commencement of treatment (on day zero) with αPD-1. ‘S’ indicates the stomach (an organ with high endogenous NIS expression). Yellow arrows indicate liver metastases, magenta arrows indicate metastases outside the liver (i.e. in the intestine). Response data for each subject following treatment determined using (D) SUVsum, (E) SUVmax, (F) total apparent volume above 5 SUV threshold and (G) number of liver lesions. Subjects NR-1 – NR-2: sgScramble KRT19 wild-type tumor cells. Subjects R-1 – R-3: sgKRT19 knockout tumor cells.